P
Landlord's Agent in 2025
Pauravi Patel
DDS Real Estate
(856) 701-6916
1 in this area
2 Total Sales
Estimated Value: $159,000 - $254,000
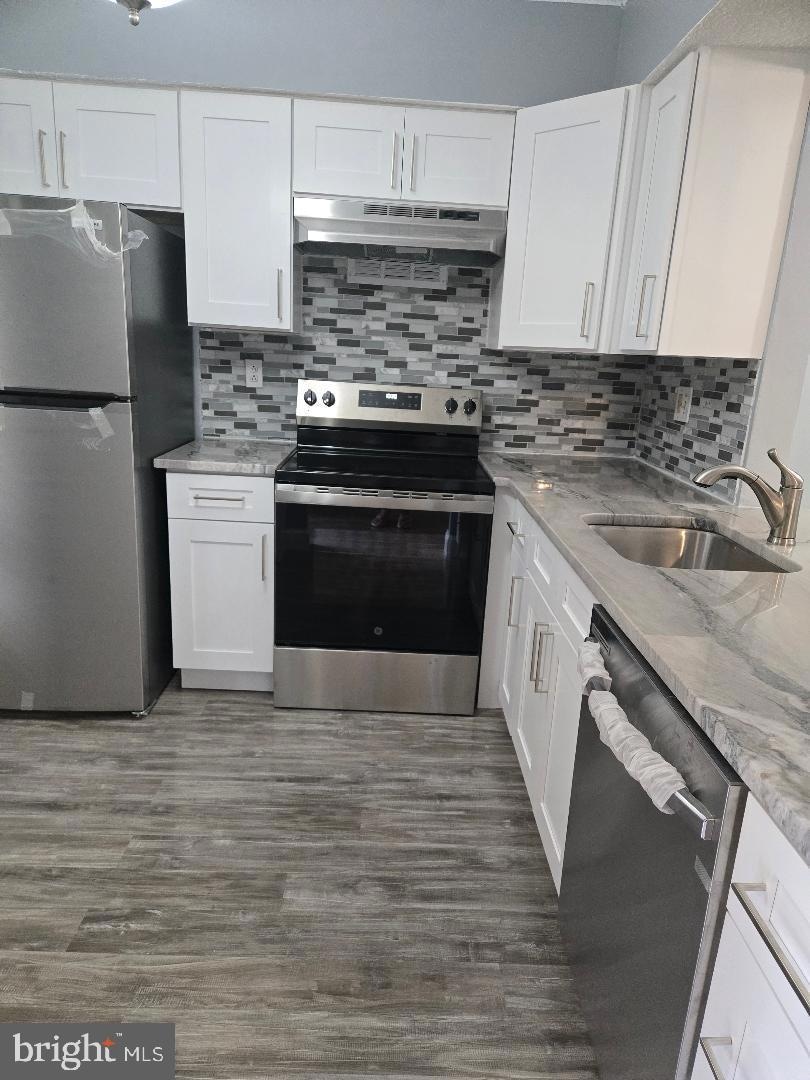
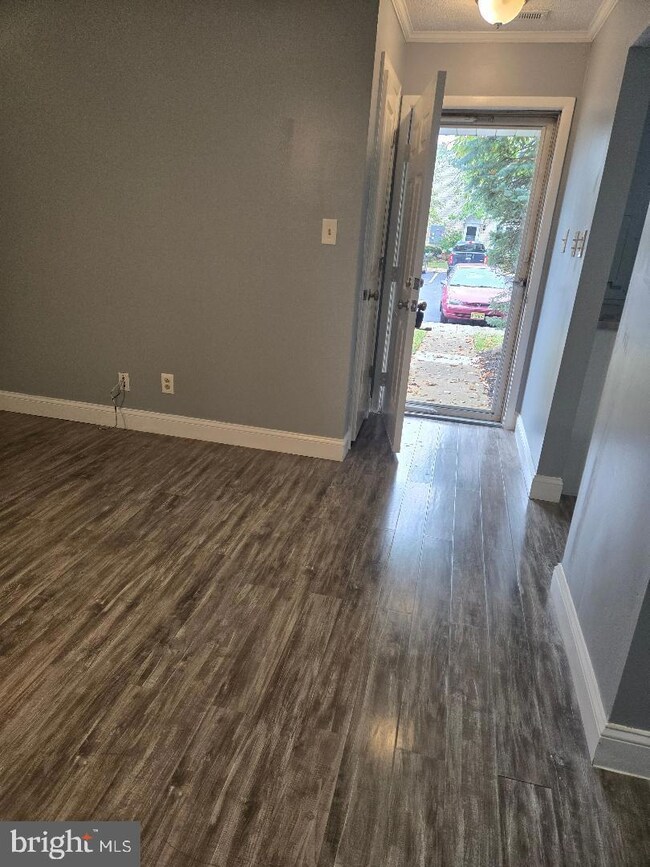
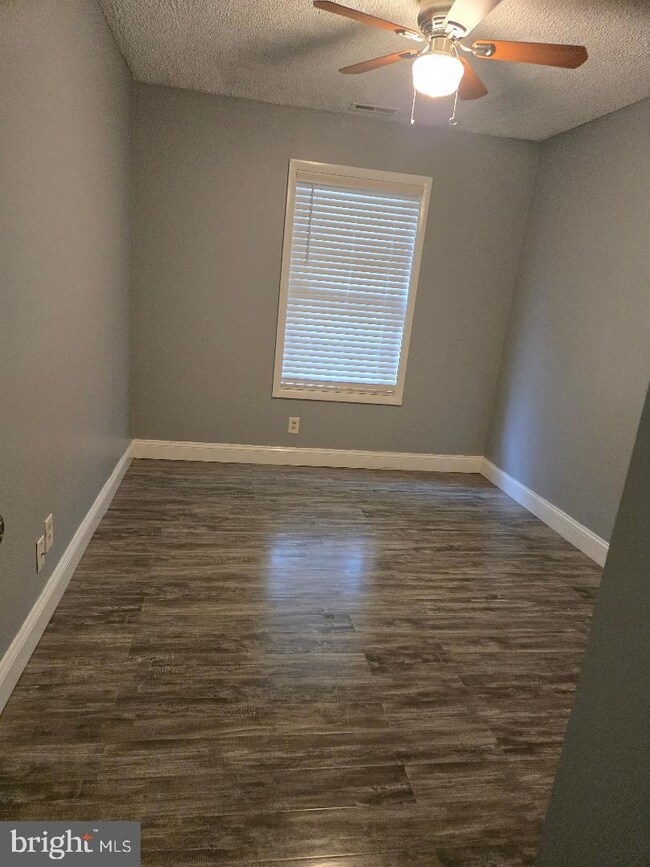
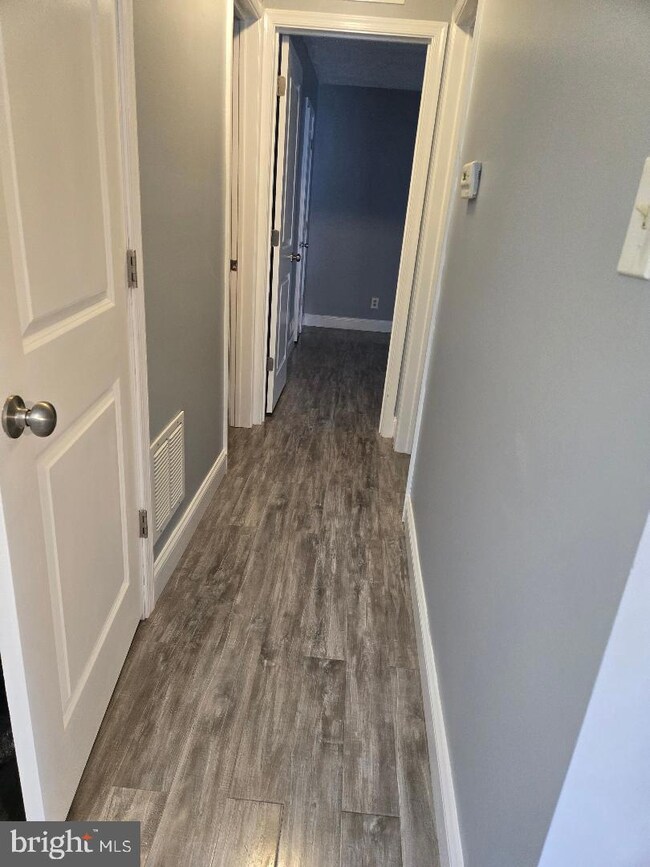
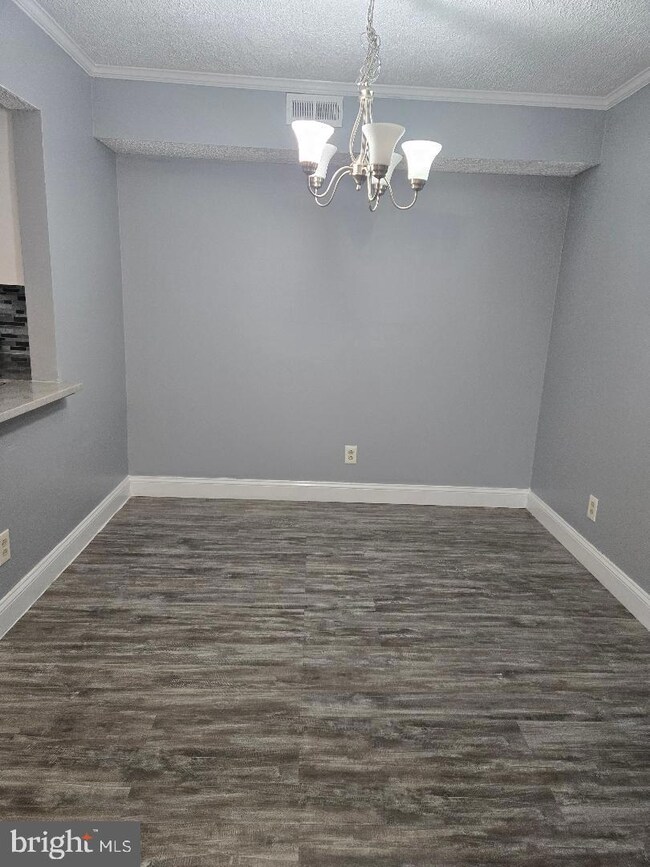
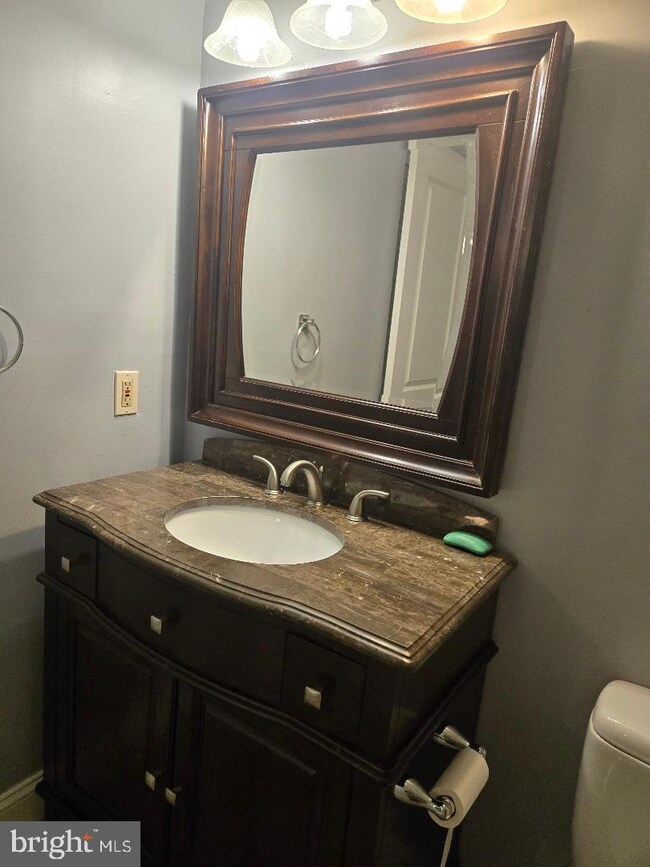
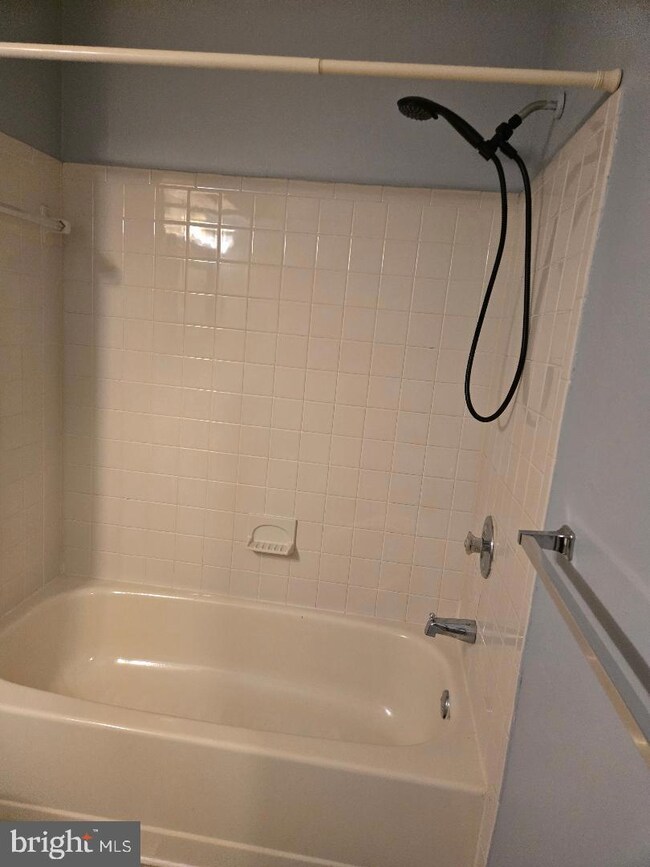
This home is located at 348A Delancey Place Unit A, Mount Laurel, NJ 08054 since 24 February 2025 and is currently priced at $226,820. This property was built in 1983. 348A Delancey Place Unit A is a home located in Burlington County with nearby schools including Larchmont Elementary School, Mount Laurel Hartford School, and T.E. Harrington Middle School.
Last Agent to Rent the Property
(856) 701-6916 papatel1972@yahoo.com DDS Real Estate License #2322434 Listed on: 02/24/2025
| Date | Buyer | Sale Price | Title Company |
|---|---|---|---|
| Parjanmay Llc | $121,000 | North Title Agency Llc | |
| John Mcmahon Properties Inc | $123,750 | Group 21 Title Agency | |
| -- | $123,800 | -- |
| Date | Event | Price | List to Sale | Price per Sq Ft | Prior Sale |
|---|---|---|---|---|---|
| 03/01/2025 03/01/25 | Rented | $1,800 | 0.0% | -- | |
| 02/28/2025 02/28/25 | Under Contract | -- | -- | -- | |
| 02/24/2025 02/24/25 | For Rent | $1,800 | +38.5% | -- | |
| 09/15/2018 09/15/18 | Rented | $1,300 | 0.0% | -- | |
| 09/11/2018 09/11/18 | Under Contract | -- | -- | -- | |
| 08/27/2018 08/27/18 | For Rent | $1,300 | 0.0% | -- | |
| 08/24/2018 08/24/18 | Sold | $121,000 | +0.8% | $130 / Sq Ft | View Prior Sale |
| 07/19/2018 07/19/18 | Pending | -- | -- | -- | |
| 06/09/2018 06/09/18 | For Sale | $120,000 | +26.3% | $129 / Sq Ft | |
| 08/08/2016 08/08/16 | Sold | $95,000 | -4.9% | $102 / Sq Ft | View Prior Sale |
| 06/27/2016 06/27/16 | Price Changed | $99,900 | -4.8% | $108 / Sq Ft | |
| 04/07/2016 04/07/16 | For Sale | $104,900 | 0.0% | $113 / Sq Ft | |
| 11/25/2014 11/25/14 | Rented | $1,150 | 0.0% | -- | |
| 10/21/2014 10/21/14 | Under Contract | -- | -- | -- | |
| 01/30/2014 01/30/14 | For Rent | $1,150 | -- | -- |
| Year | Tax Paid | Tax Assessment Tax Assessment Total Assessment is a certain percentage of the fair market value that is determined by local assessors to be the total taxable value of land and additions on the property. | Land | Improvement |
|---|---|---|---|---|
| 2025 | $3,236 | $102,500 | $25,000 | $77,500 |
| 2024 | $3,114 | $102,500 | $25,000 | $77,500 |
| 2023 | $3,114 | $102,500 | $25,000 | $77,500 |
| 2022 | $3,104 | $102,500 | $25,000 | $77,500 |
| 2021 | $3,045 | $102,500 | $25,000 | $77,500 |
| 2020 | $2,986 | $102,500 | $25,000 | $77,500 |
| 2019 | $2,955 | $102,500 | $25,000 | $77,500 |
| 2018 | $2,933 | $102,500 | $25,000 | $77,500 |
| 2017 | $2,857 | $102,500 | $25,000 | $77,500 |
| 2016 | $2,814 | $102,500 | $25,000 | $77,500 |
| 2015 | $2,781 | $102,500 | $25,000 | $77,500 |
| 2014 | $2,753 | $102,500 | $25,000 | $77,500 |
P
Landlord's Agent in 2025
Pauravi Patel
DDS Real Estate
(856) 701-6916
1 in this area
2 Total Sales

Tenant's Agent in 2025
Jason Coyle
Keller Williams Realty - Moorestown
(856) 266-7505
6 Total Sales
Seller's Agent in 2018
Lorna Kaim
Compass New Jersey, LLC - Moorestown
(856) 986-2642
12 in this area
103 Total Sales
Seller's Agent in 2018
Dolores Defreitas
BHHS Fox & Roach
(856) 904-8460
5 in this area
82 Total Sales
Buyer's Agent in 2018
Ines De La Cruz
EXP Realty, LLC
(609) 313-8518
3 in this area
77 Total Sales
Buyer's Agent in 2018
Patrease Leonard
Fathom Realty NJ, LLC
(862) 245-1425
37 Total Sales
Source: Bright MLS
MLS Number: NJBL2081612
APN: 24-00305-01-00209-0000-C0097
Disclaimer: Certain information contained herein is derived from information provided by parties other than Homes.com. All information provided is deemed reliable, but is not guaranteed to be accurate and should be independently verified.
![]() The data relating to real estate for sale on this website appears in part through the BRIGHT Internet Data Exchange program, a voluntary cooperative exchange of property listing data between licensed real estate brokerage firms, and is provided by BRIGHT through a licensing agreement.
The data relating to real estate for sale on this website appears in part through the BRIGHT Internet Data Exchange program, a voluntary cooperative exchange of property listing data between licensed real estate brokerage firms, and is provided by BRIGHT through a licensing agreement.
Listing information is from various brokers who participate in the Bright MLS IDX program and not all listings may be visible on the site.
The property information being provided on or through the website is for the personal, non-commercial use of consumers and such information may not be used for any purpose other than to identify prospective properties consumers may be interested in purchasing.
Some properties which appear for sale on the website may no longer be available because they are for instance, under contract, sold or are no longer being offered for sale.
Property information displayed is deemed reliable but is not guaranteed.
Copyright 2025 Bright MLS, Inc.