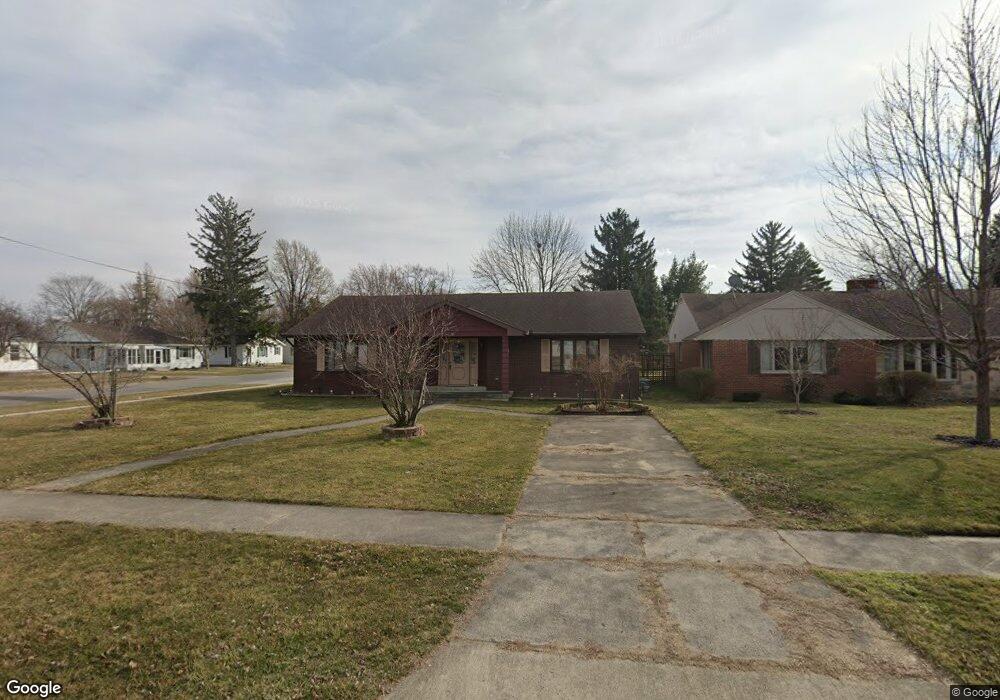
349 7th St Findlay, OH 45840
Estimated Value: $263,000 - $296,000
4
Beds
2
Baths
1,600
Sq Ft
$174/Sq Ft
Est. Value
About This Home
This home is located at 349 7th St, Findlay, OH 45840 and is currently estimated at $278,074, approximately $173 per square foot. 349 7th St is a home located in Hancock County with nearby schools including Jefferson Elementary School, Chamberlin Hill Elementary School, and Donnell Middle School.
Ownership History
Date
Name
Owned For
Owner Type
Purchase Details
Closed on
Dec 14, 2005
Sold by
Adams Roxie
Bought by
Chanthavong Ka and Chanthavong Inh
Current Estimated Value
Purchase Details
Closed on
Oct 10, 1990
Bought by
Robinson Morris and Robinson Marlene
Purchase Details
Closed on
Jan 30, 1986
Bought by
Robinson Morris R
Purchase Details
Closed on
May 24, 1985
Bought by
Jenkins Shirley B
Create a Home Valuation Report for This Property
The Home Valuation Report is an in-depth analysis detailing your home's value as well as a comparison with similar homes in the area
Home Values in the Area
Average Home Value in this Area
Purchase History
| Date | Buyer | Sale Price | Title Company |
|---|---|---|---|
| Chanthavong Ka | $162,500 | Golden Key Title Agency | |
| Robinson Morris | -- | -- | |
| Robinson Morris R | $11,000 | -- | |
| Jenkins Shirley B | -- | -- |
Source: Public Records
Tax History
| Year | Tax Paid | Tax Assessment Tax Assessment Total Assessment is a certain percentage of the fair market value that is determined by local assessors to be the total taxable value of land and additions on the property. | Land | Improvement |
|---|---|---|---|---|
| 2024 | $2,956 | $83,190 | $8,900 | $74,290 |
| 2023 | $2,960 | $83,190 | $8,900 | $74,290 |
| 2022 | $2,950 | $83,190 | $8,900 | $74,290 |
| 2021 | $3,390 | $83,300 | $8,890 | $74,410 |
| 2020 | $3,390 | $83,300 | $8,890 | $74,410 |
| 2019 | $3,322 | $83,300 | $8,890 | $74,410 |
| 2018 | $2,898 | $66,640 | $7,120 | $59,520 |
| 2017 | $2,898 | $66,640 | $7,120 | $59,520 |
| 2016 | $2,851 | $66,640 | $7,120 | $59,520 |
| 2015 | $2,494 | $57,030 | $8,300 | $48,730 |
| 2014 | $2,494 | $57,030 | $8,300 | $48,730 |
| 2012 | $2,513 | $57,030 | $8,300 | $48,730 |
Source: Public Records
Map
Nearby Homes
- 347 7th St
- 335 7th St
- 1609 Washington Ave
- 1615 Washington Ave
- 350 Fairlawn Place
- 1605 Washington Ave
- 342 Fairlawn Place
- 1619 Washington Ave
- 1601 Washington Ave
- 329 7th St
- 1631 Washington Ave
- 350 7th St
- 342 7th St
- 338 Fairlawn Place
- 1521 Washington Ave
- 1633 Washington Ave
- 0 Washington Ave Unit H126002
- 0 Washington Ave Unit H124813
- 0 Washington Ave Unit H133126
- 338 7th St
Your Personal Tour Guide
Ask me questions while you tour the home.