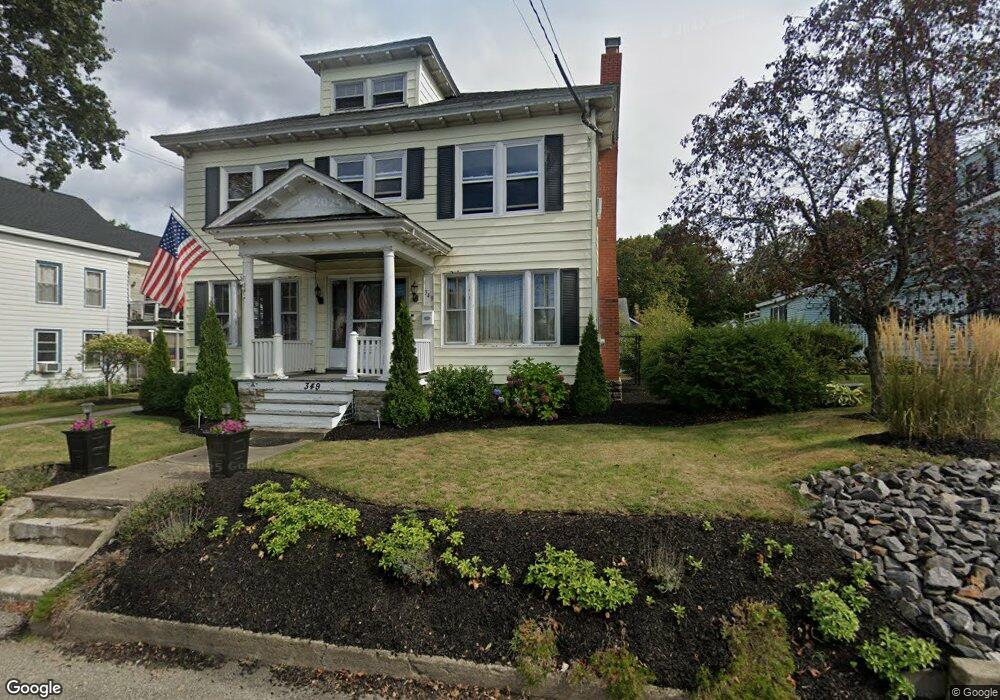
349 Elm St Biddeford, ME 04005
Estimated Value: $477,000 - $534,000
4
Beds
2
Baths
2,104
Sq Ft
$239/Sq Ft
Est. Value
About This Home
This home is located at 349 Elm St, Biddeford, ME 04005 and is currently estimated at $501,806, approximately $238 per square foot. 349 Elm St is a home located in York County with nearby schools including John F Kennedy Memorial School, Biddeford Primary School, and Biddeford Intermediate School.
Ownership History
Date
Name
Owned For
Owner Type
Purchase Details
Closed on
Nov 10, 2010
Sold by
Staples Wayne T and Staples Diane E
Bought by
Horton Lance P and Hallett Jeffrey P
Current Estimated Value
Home Financials for this Owner
Home Financials are based on the most recent Mortgage that was taken out on this home.
Original Mortgage
$208,800
Outstanding Balance
$137,623
Interest Rate
4.25%
Mortgage Type
Purchase Money Mortgage
Estimated Equity
$364,183
Create a Home Valuation Report for This Property
The Home Valuation Report is an in-depth analysis detailing your home's value as well as a comparison with similar homes in the area
Home Values in the Area
Average Home Value in this Area
Purchase History
| Date | Buyer | Sale Price | Title Company |
|---|---|---|---|
| Horton Lance P | -- | -- | |
| Horton Lance P | -- | -- |
Source: Public Records
Mortgage History
| Date | Status | Borrower | Loan Amount |
|---|---|---|---|
| Open | Horton Lance P | $208,800 | |
| Closed | Horton Lance P | $208,800 |
Source: Public Records
Tax History Compared to Growth
Tax History
| Year | Tax Paid | Tax Assessment Tax Assessment Total Assessment is a certain percentage of the fair market value that is determined by local assessors to be the total taxable value of land and additions on the property. | Land | Improvement |
|---|---|---|---|---|
| 2024 | $5,133 | $361,000 | $137,400 | $223,600 |
| 2023 | $4,736 | $361,000 | $137,400 | $223,600 |
| 2022 | $4,275 | $260,500 | $82,900 | $177,600 |
| 2021 | $3,568 | $220,700 | $69,100 | $151,600 |
| 2020 | $3,497 | $198,900 | $58,800 | $140,100 |
| 2019 | $3,974 | $198,900 | $58,800 | $140,100 |
| 2018 | $2,382 | $198,900 | $58,800 | $140,100 |
| 2017 | $2,577 | $194,600 | $58,800 | $135,800 |
| 2016 | $3,865 | $194,600 | $58,800 | $135,800 |
| 2015 | $3,594 | $194,600 | $58,800 | $135,800 |
| 2014 | $3,614 | $200,300 | $58,800 | $141,500 |
| 2013 | -- | $205,000 | $62,200 | $142,800 |
Source: Public Records
Map
Nearby Homes