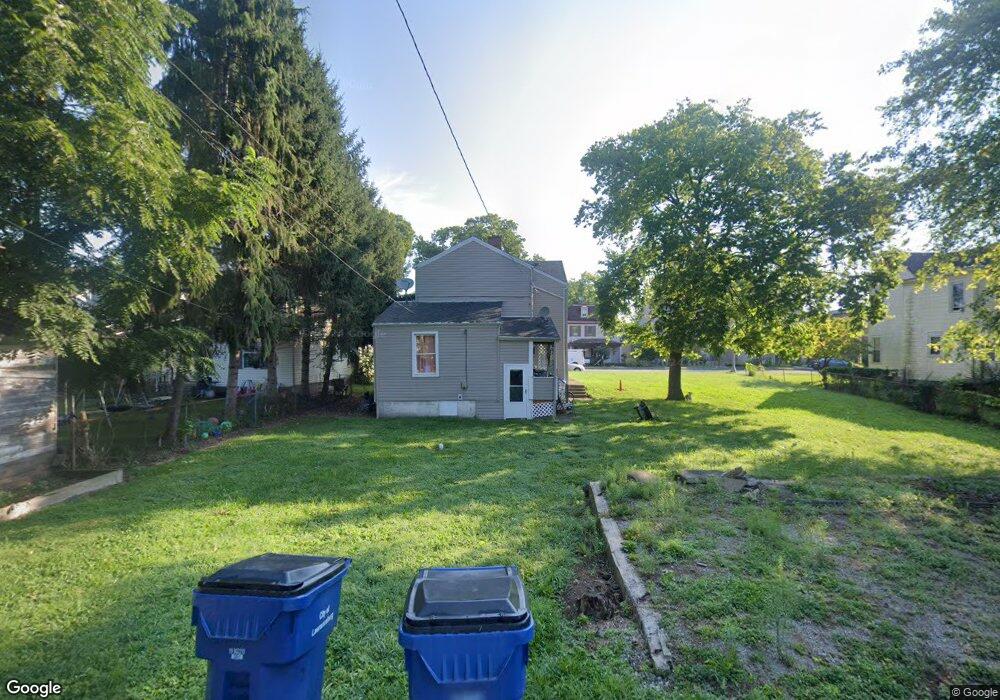
349 Elm St Lawrenceburg, IN 47025
Estimated Value: $153,000 - $224,707
3
Beds
2
Baths
2,260
Sq Ft
$83/Sq Ft
Est. Value
About This Home
This home is located at 349 Elm St, Lawrenceburg, IN 47025 and is currently estimated at $188,427, approximately $83 per square foot. 349 Elm St is a home located in Dearborn County with nearby schools including Lawrenceburg Primary School, Central Elementary School, and Greendale Middle School.
Ownership History
Date
Name
Owned For
Owner Type
Purchase Details
Closed on
Feb 24, 2023
Sold by
Seymour General Contracting Inc
Bought by
Lyttle Tim and Lyttle Cheryl
Current Estimated Value
Home Financials for this Owner
Home Financials are based on the most recent Mortgage that was taken out on this home.
Original Mortgage
$97,500
Outstanding Balance
$90,924
Interest Rate
6.33%
Mortgage Type
New Conventional
Estimated Equity
$108,860
Purchase Details
Closed on
Jun 30, 2016
Sold by
Bartley Brenda S
Bought by
Seymour General Contracting Inc
Create a Home Valuation Report for This Property
The Home Valuation Report is an in-depth analysis detailing your home's value as well as a comparison with similar homes in the area
Home Values in the Area
Average Home Value in this Area
Purchase History
| Date | Buyer | Sale Price | Title Company |
|---|---|---|---|
| Lyttle Tim | -- | None Listed On Document | |
| Seymour General Contracting Inc | -- | Attorney |
Source: Public Records
Mortgage History
| Date | Status | Borrower | Loan Amount |
|---|---|---|---|
| Open | Lyttle Tim | $97,500 |
Source: Public Records
Tax History Compared to Growth
Tax History
| Year | Tax Paid | Tax Assessment Tax Assessment Total Assessment is a certain percentage of the fair market value that is determined by local assessors to be the total taxable value of land and additions on the property. | Land | Improvement |
|---|---|---|---|---|
| 2024 | $3,076 | $153,800 | $17,100 | $136,700 |
| 2023 | $2,928 | $146,400 | $17,100 | $129,300 |
| 2022 | $2,869 | $143,300 | $17,100 | $126,200 |
| 2021 | $2,595 | $129,600 | $17,100 | $112,500 |
| 2020 | $2,594 | $129,600 | $17,100 | $112,500 |
| 2019 | $2,261 | $113,000 | $17,100 | $95,900 |
| 2018 | $2,011 | $100,500 | $17,100 | $83,400 |
| 2017 | $2,123 | $106,100 | $17,100 | $89,000 |
| 2016 | $2,123 | $106,100 | $17,100 | $89,000 |
| 2014 | $2,126 | $106,300 | $17,100 | $89,200 |
Source: Public Records
Map
Nearby Homes