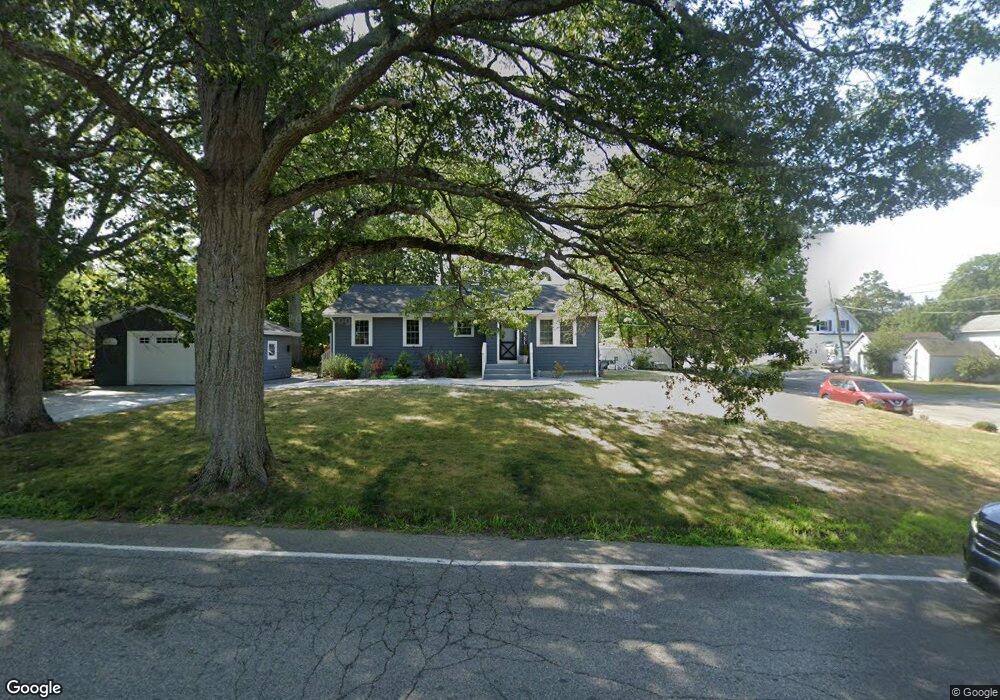
349 Field St Brockton, MA 02302
Montello NeighborhoodEstimated Value: $440,000 - $473,000
2
Beds
1
Bath
1,088
Sq Ft
$420/Sq Ft
Est. Value
About This Home
This home is located at 349 Field St, Brockton, MA 02302 and is currently estimated at $457,254, approximately $420 per square foot. 349 Field St is a home located in Plymouth County with nearby schools including Brookfield Elementary School, Mary E. Baker Elementary School, and Downey Elementary School.
Ownership History
Date
Name
Owned For
Owner Type
Purchase Details
Closed on
Sep 16, 2016
Sold by
Cabral Robert F
Bought by
Kelley Patrick S and Kelley Lindsey E
Current Estimated Value
Home Financials for this Owner
Home Financials are based on the most recent Mortgage that was taken out on this home.
Original Mortgage
$270,000
Outstanding Balance
$215,666
Interest Rate
3.43%
Mortgage Type
New Conventional
Estimated Equity
$241,588
Purchase Details
Closed on
Nov 9, 2015
Sold by
Williams Rt
Bought by
Cabral Robert F
Purchase Details
Closed on
Oct 16, 2015
Sold by
Williams David J and Williams George R
Bought by
Ryan Donna M
Create a Home Valuation Report for This Property
The Home Valuation Report is an in-depth analysis detailing your home's value as well as a comparison with similar homes in the area
Home Values in the Area
Average Home Value in this Area
Purchase History
| Date | Buyer | Sale Price | Title Company |
|---|---|---|---|
| Kelley Patrick S | $290,000 | -- | |
| Cabral Robert F | $60,000 | -- | |
| Ryan Donna M | -- | -- |
Source: Public Records
Mortgage History
| Date | Status | Borrower | Loan Amount |
|---|---|---|---|
| Open | Kelley Patrick S | $270,000 |
Source: Public Records
Tax History Compared to Growth
Tax History
| Year | Tax Paid | Tax Assessment Tax Assessment Total Assessment is a certain percentage of the fair market value that is determined by local assessors to be the total taxable value of land and additions on the property. | Land | Improvement |
|---|---|---|---|---|
| 2025 | $4,688 | $387,100 | $159,000 | $228,100 |
| 2024 | $4,370 | $363,600 | $159,000 | $204,600 |
| 2023 | $4,324 | $333,100 | $109,200 | $223,900 |
| 2022 | $4,139 | $296,300 | $99,300 | $197,000 |
| 2021 | $4,003 | $276,100 | $91,800 | $184,300 |
| 2020 | $3,972 | $262,200 | $80,700 | $181,500 |
| 2019 | $3,638 | $234,100 | $76,900 | $157,200 |
| 2018 | $3,517 | $219,000 | $76,900 | $142,100 |
| 2017 | $2,542 | $157,900 | $76,900 | $81,000 |
| 2016 | $2,550 | $146,900 | $73,300 | $73,600 |
| 2015 | $2,370 | $130,600 | $73,300 | $57,300 |
| 2014 | $2,486 | $137,100 | $73,300 | $63,800 |
Source: Public Records
Map
Nearby Homes