G
Landlord's Agent in 2013
George Fossella
Hank Reardon Realty
Estimated Value: $730,000 - $796,000
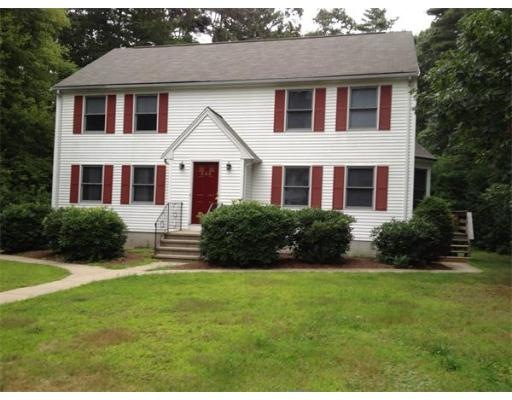
This home is located at 349 Foundry St, North Easton, MA 02356 since 31 July 2013 and is currently priced at $767,488. This property was built in 2002. 349 Foundry St is a home located in Bristol County with nearby schools including Easton Middle School and Oliver Ames High School.
Home Type
Other
Est. Annual Taxes
$8,037
Year Built
2002
Lot Details
0
| Date | Event | Price | Change | Sq Ft Price |
|---|---|---|---|---|
| 07/31/2013 07/31/13 | Rented | $1,600 | 0.0% | -- |
| 07/31/2013 07/31/13 | For Rent | $1,600 | -- | -- |
| Year | Tax Paid | Tax Assessment Tax Assessment Total Assessment is a certain percentage of the fair market value that is determined by local assessors to be the total taxable value of land and additions on the property. | Land | Improvement |
|---|---|---|---|---|
| 2025 | $8,037 | $644,000 | $378,200 | $265,800 |
| 2024 | $7,942 | $594,900 | $329,100 | $265,800 |
| 2023 | $8,445 | $578,800 | $329,100 | $249,700 |
| 2022 | $7,932 | $515,400 | $270,000 | $245,400 |
| 2021 | $7,537 | $486,900 | $245,700 | $241,200 |
| 2020 | $7,219 | $469,400 | $235,800 | $233,600 |
| 2019 | $7,437 | $466,000 | $230,800 | $235,200 |
| 2018 | $6,887 | $437,900 | $218,400 | $219,500 |
| 2017 | $6,668 | $411,100 | $218,400 | $192,700 |
| 2016 | $6,536 | $403,700 | $211,000 | $192,700 |
| 2015 | $6,212 | $370,200 | $177,500 | $192,700 |
| 2014 | $6,119 | $367,500 | $174,800 | $192,700 |
G
Landlord's Agent in 2013
George Fossella
Hank Reardon Realty
Source: MLS Property Information Network (MLS PIN)
MLS Number: 71562979
APN: EAST-000016R-000068
Disclaimer: Certain information contained herein is derived from information provided by parties other than Homes.com. All information provided is deemed reliable, but is not guaranteed to be accurate and should be independently verified.
![]() The property listing data and information, or the Images, set forth herein were provided to MLS Property Information Network, Inc. from third party sources, including sellers, lessors and public records, and were compiled by MLS Property Information Network, Inc. The property listing data and information, and the Images, are for the personal, non-commercial use of consumers having a good faith interest in purchasing or leasing listed properties of the type displayed to them and may not be used for any purpose other than to identify prospective properties which such consumers may have a good faith interest in purchasing or leasing. MLS Property Information Network, Inc. and its subscribers disclaim any and all representations and warranties as to the accuracy of the property listing data and information, or as to the accuracy of any of the Images, set forth herein.
The property listing data and information, or the Images, set forth herein were provided to MLS Property Information Network, Inc. from third party sources, including sellers, lessors and public records, and were compiled by MLS Property Information Network, Inc. The property listing data and information, and the Images, are for the personal, non-commercial use of consumers having a good faith interest in purchasing or leasing listed properties of the type displayed to them and may not be used for any purpose other than to identify prospective properties which such consumers may have a good faith interest in purchasing or leasing. MLS Property Information Network, Inc. and its subscribers disclaim any and all representations and warranties as to the accuracy of the property listing data and information, or as to the accuracy of any of the Images, set forth herein.
