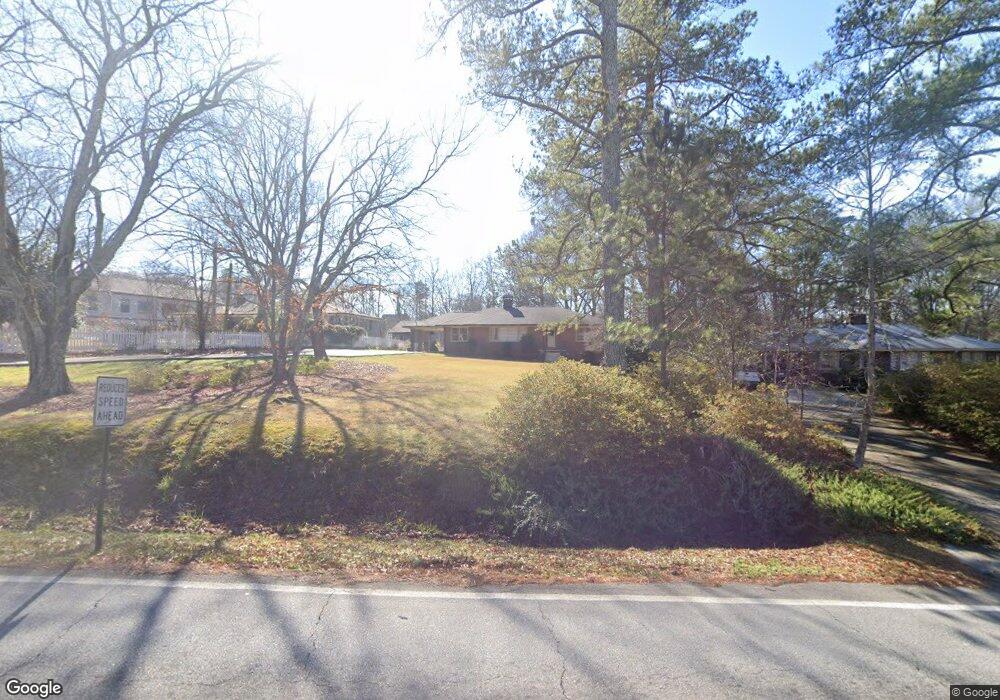
349 Holcomb Bridge Rd Norcross, GA 30071
Estimated Value: $380,000 - $468,070
3
Beds
2
Baths
1,458
Sq Ft
$284/Sq Ft
Est. Value
About This Home
This home is located at 349 Holcomb Bridge Rd, Norcross, GA 30071 and is currently estimated at $414,518, approximately $284 per square foot. 349 Holcomb Bridge Rd is a home located in Gwinnett County with nearby schools including Susan Stripling Elementary School, Pinckneyville Middle School, and Paul Duke STEM High School.
Ownership History
Date
Name
Owned For
Owner Type
Purchase Details
Closed on
Aug 31, 2017
Sold by
Orouke Cathy Ann
Bought by
Orourke Mary E
Current Estimated Value
Home Financials for this Owner
Home Financials are based on the most recent Mortgage that was taken out on this home.
Original Mortgage
$154,700
Outstanding Balance
$128,671
Interest Rate
3.93%
Mortgage Type
New Conventional
Estimated Equity
$285,847
Create a Home Valuation Report for This Property
The Home Valuation Report is an in-depth analysis detailing your home's value as well as a comparison with similar homes in the area
Home Values in the Area
Average Home Value in this Area
Purchase History
| Date | Buyer | Sale Price | Title Company |
|---|---|---|---|
| Orourke Mary E | $182,000 | -- |
Source: Public Records
Mortgage History
| Date | Status | Borrower | Loan Amount |
|---|---|---|---|
| Open | Orourke Mary E | $154,700 |
Source: Public Records
Tax History Compared to Growth
Tax History
| Year | Tax Paid | Tax Assessment Tax Assessment Total Assessment is a certain percentage of the fair market value that is determined by local assessors to be the total taxable value of land and additions on the property. | Land | Improvement |
|---|---|---|---|---|
| 2025 | $3,277 | $221,520 | $38,000 | $183,520 |
| 2024 | $3,407 | $141,240 | $50,000 | $91,240 |
| 2023 | $3,407 | $151,400 | $37,600 | $113,800 |
| 2022 | $3,062 | $123,840 | $34,000 | $89,840 |
| 2021 | $2,841 | $109,560 | $26,720 | $82,840 |
| 2020 | $2,869 | $109,560 | $26,720 | $82,840 |
| 2019 | $2,726 | $71,360 | $24,000 | $47,360 |
| 2018 | $2,049 | $71,360 | $24,000 | $47,360 |
| 2016 | $1,905 | $57,600 | $24,000 | $33,600 |
| 2015 | $2,116 | $48,000 | $20,000 | $28,000 |
| 2014 | -- | $48,000 | $20,000 | $28,000 |
Source: Public Records
Map
Nearby Homes
- 479 Holcomb Bridge Rd
- 519 Holcomb Bridge Rd
- 482 Nesbit St
- 90 W Peachtree St
- 6000 Hunter Hall Ct
- 453 Hunter St
- 695 Holcomb Bridge Rd
- 757 Sunset Dr
- 231 Sunset Hills Dr
- 782 Holcomb Bridge Rd
- 267 Longview Dr
- 186 Wingo St
- 204 Wingo St
- 435 Webb Dr
- 5766 Buford Hwy
- 2798 Maddison Towns Ave
- 53AND63 Born St
- 505 Cochran Dr
- 265 Dogwood Walk Ln Unit 7
- 63 Born St NW
- 333 Holcomb Bridge Rd
- 377 Holcomb Bridge Rd
- 399 Holcomb Bridge Rd
- 299 Ruth St
- 297 Ruth St
- 307 Ruth St NW
- 5931 Brundage Ln
- 5941 Brundage Ln
- 5921 Brundage Ln
- 317 Holcomb Bridge Rd
- 5911 Brundage Ln
- 165 Ruth St
- 403 Holcomb Bridge Rd
- 278 Old Commons Ct
- 5901 Brundage Ln
- 5901 Brundage Ln Unit 1
- 308 Old Commons Ct
- 5961 Brundage Ln
- 5961 Brundage Ln Unit 6
- 396 Nesbit St