Estimated Value: $165,075 - $215,000
3
Beds
2
Baths
1,354
Sq Ft
$146/Sq Ft
Est. Value
About This Home
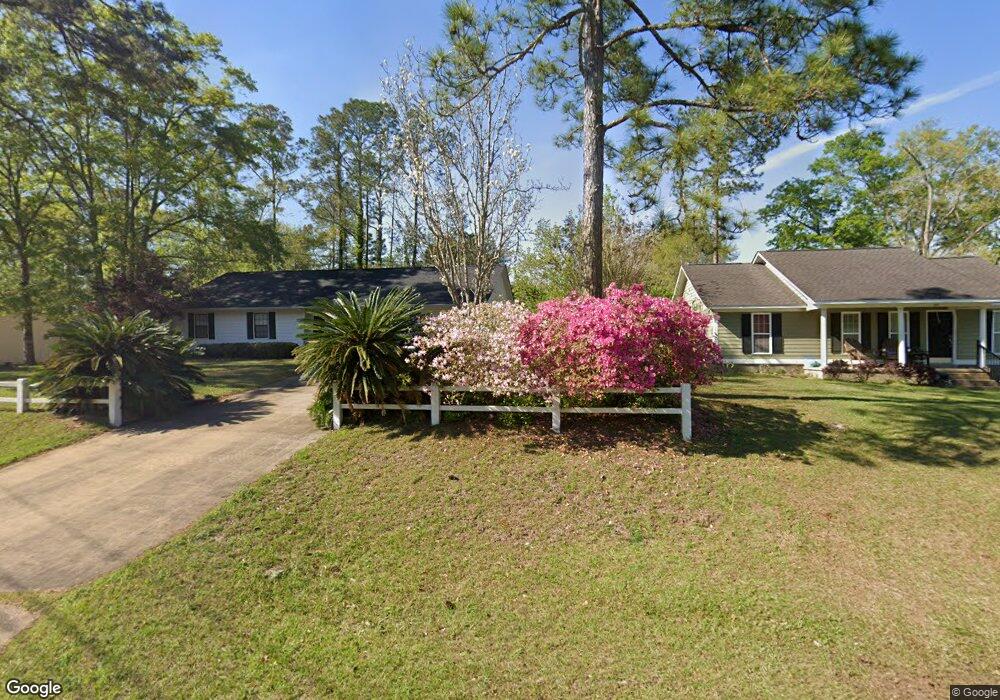
This home is located at 349 Horseshoe Bend, Cairo, GA 39828 and is currently estimated at $197,019, approximately $145 per square foot. 349 Horseshoe Bend is a home located in Grady County with nearby schools including Cairo High School.
Ownership History
Date
Name
Owned For
Owner Type
Purchase Details
Closed on
Aug 15, 2006
Sold by
Phillips Rose M
Bought by
Phillips Rose M and Phillips Ronald D
Current Estimated Value
Home Financials for this Owner
Home Financials are based on the most recent Mortgage that was taken out on this home.
Original Mortgage
$132,000
Outstanding Balance
$79,122
Interest Rate
6.73%
Mortgage Type
New Conventional
Estimated Equity
$117,898
Purchase Details
Closed on
May 19, 2003
Sold by
Gibson Joy Lynn
Bought by
Payne Joy G
Purchase Details
Closed on
Oct 18, 1999
Sold by
Herndon Kyle Ted
Bought by
Gibson Joy Lynn
Purchase Details
Closed on
Aug 28, 1997
Sold by
Wagner Robert Wilson
Bought by
Herndon Kyle Ted
Purchase Details
Closed on
Jan 15, 1995
Sold by
Majors Carrie M
Bought by
Wagner Robert Wilson
Purchase Details
Closed on
Jul 21, 1993
Bought by
Majors Carrie M
Create a Home Valuation Report for This Property
The Home Valuation Report is an in-depth analysis detailing your home's value as well as a comparison with similar homes in the area
Home Values in the Area
Average Home Value in this Area
Purchase History
| Date | Buyer | Sale Price | Title Company |
|---|---|---|---|
| Phillips Rose M | -- | -- | |
| Phillips Rose M | $132,000 | -- | |
| Payne Joy G | -- | -- | |
| Gibson Joy Lynn | $81,000 | -- | |
| Herndon Kyle Ted | $74,500 | -- | |
| Wagner Robert Wilson | $15,000 | -- | |
| Majors Carrie M | $5,200 | -- |
Source: Public Records
Mortgage History
| Date | Status | Borrower | Loan Amount |
|---|---|---|---|
| Open | Phillips Rose M | $132,000 |
Source: Public Records
Tax History Compared to Growth
Tax History
| Year | Tax Paid | Tax Assessment Tax Assessment Total Assessment is a certain percentage of the fair market value that is determined by local assessors to be the total taxable value of land and additions on the property. | Land | Improvement |
|---|---|---|---|---|
| 2024 | $2,155 | $56,174 | $6,000 | $50,174 |
| 2023 | $1,574 | $44,199 | $6,000 | $38,199 |
| 2022 | $1,640 | $44,199 | $6,000 | $38,199 |
| 2021 | $1,645 | $44,199 | $6,000 | $38,199 |
| 2020 | $1,649 | $44,199 | $6,000 | $38,199 |
| 2019 | $1,649 | $44,199 | $6,000 | $38,199 |
| 2018 | $1,568 | $44,199 | $6,000 | $38,199 |
| 2017 | $1,508 | $44,199 | $6,000 | $38,199 |
| 2016 | $1,308 | $37,684 | $6,000 | $31,684 |
| 2015 | $1,295 | $37,684 | $6,000 | $31,684 |
| 2014 | $1,295 | $37,684 | $6,000 | $31,684 |
| 2013 | -- | $36,964 | $12,000 | $24,964 |
Source: Public Records
Map
Nearby Homes
- 347 Horseshoe Bend
- 351 Horseshoe Bend
- 306 Midland Place
- 304 Midland Place
- 343 Horseshoe Bend
- 344 Horseshoe Bend
- 1332 Brookwood Dr SE
- 342 Horseshoe Bend
- 1368 Brookwood Dr SE
- 341 Horseshoe Bend
- 1310 Brookwood Dr SE
- 340 Horseshoe Bend
- 307 Midland Place
- 305 Midland Place
- 300 Midland Place
- 337 Horseshoe Bend
- 309 Midland Place
- 338 Horseshoe Bend
- 317 Buchannan St SE
- 311 Buchannan St SE