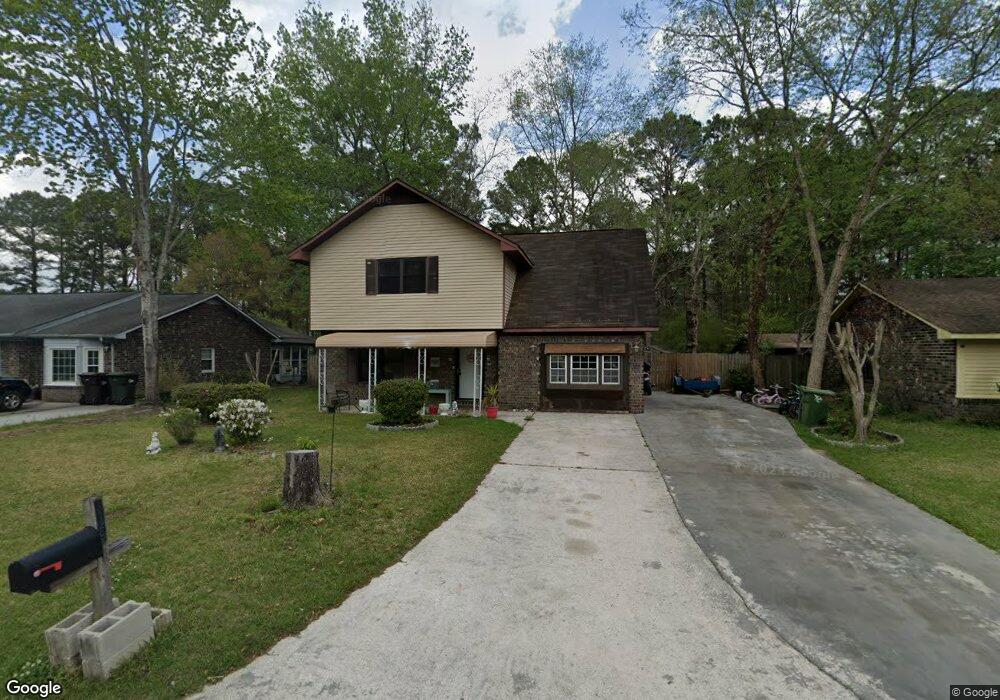
349 Huntsman Dr Goose Creek, SC 29445
Estimated Value: $247,000 - $296,000
--
Bed
--
Bath
1,476
Sq Ft
$182/Sq Ft
Est. Value
About This Home
This home is located at 349 Huntsman Dr, Goose Creek, SC 29445 and is currently estimated at $268,918, approximately $182 per square foot. 349 Huntsman Dr is a home located in Berkeley County with nearby schools including Westview Primary School, Westview Elementary School, and Westview Middle School.
Ownership History
Date
Name
Owned For
Owner Type
Purchase Details
Closed on
Oct 31, 2022
Sold by
Hyman Jason T
Bought by
Luciano James Omar and Luciano Zoe A
Current Estimated Value
Home Financials for this Owner
Home Financials are based on the most recent Mortgage that was taken out on this home.
Original Mortgage
$186,697
Outstanding Balance
$179,852
Interest Rate
6.02%
Mortgage Type
VA
Estimated Equity
$89,066
Purchase Details
Closed on
Jun 17, 2005
Sold by
Elrod Lance and Elrod Trisha
Bought by
Hyman Jason T
Home Financials for this Owner
Home Financials are based on the most recent Mortgage that was taken out on this home.
Original Mortgage
$139,000
Interest Rate
8.37%
Mortgage Type
Adjustable Rate Mortgage/ARM
Purchase Details
Closed on
May 1, 2002
Sold by
Wolfe Cecil W and Wolfe Elizabeth T
Bought by
Elrod Lance and Elrod Trisha
Create a Home Valuation Report for This Property
The Home Valuation Report is an in-depth analysis detailing your home's value as well as a comparison with similar homes in the area
Home Values in the Area
Average Home Value in this Area
Purchase History
| Date | Buyer | Sale Price | Title Company |
|---|---|---|---|
| Luciano James Omar | $182,500 | -- | |
| Hyman Jason T | $139,000 | -- | |
| Elrod Lance | $129,000 | -- |
Source: Public Records
Mortgage History
| Date | Status | Borrower | Loan Amount |
|---|---|---|---|
| Open | Luciano James Omar | $186,697 | |
| Previous Owner | Hyman Jason T | $139,000 |
Source: Public Records
Tax History Compared to Growth
Tax History
| Year | Tax Paid | Tax Assessment Tax Assessment Total Assessment is a certain percentage of the fair market value that is determined by local assessors to be the total taxable value of land and additions on the property. | Land | Improvement |
|---|---|---|---|---|
| 2025 | $1,271 | $234,900 | $60,000 | $174,900 |
| 2024 | $1,271 | $9,396 | $2,400 | $6,996 |
| 2023 | $1,271 | $9,396 | $2,400 | $6,996 |
| 2022 | $2,825 | $13,278 | $2,700 | $10,578 |
| 2021 | $2,896 | $5,870 | $1,360 | $4,509 |
| 2020 | $1,003 | $5,869 | $1,360 | $4,509 |
| 2019 | $956 | $5,869 | $1,360 | $4,509 |
| 2018 | $874 | $5,104 | $1,200 | $3,904 |
| 2017 | $868 | $5,104 | $1,200 | $3,904 |
| 2016 | $874 | $5,100 | $1,200 | $3,900 |
| 2015 | $826 | $5,100 | $1,200 | $3,900 |
| 2014 | $774 | $5,100 | $1,200 | $3,900 |
| 2013 | -- | $5,100 | $1,200 | $3,900 |
Source: Public Records
Map
Nearby Homes
- 216 Foxborough Rd
- 304 Vixen Blvd
- 246 Foxborough Rd
- 369 Old Mount Holly Rd
- 105 Barrington Blvd
- 102 Barrington Blvd
- 11 Hunters Ct
- 204 Cane Break Ln
- 107 Guildford Dr
- 113 Rockdale Ln
- Lot 3 Thurgood Dr
- 215 Woodland Lakes Rd
- 111 Bassett Ct
- 102 Brush Blvd
- 803 Gunston Hall Rd
- 110 Red Cypress Dr
- 128 Foxborough Rd
- 119 Stratford Dr
- 110 N Pembroke Dr
- 124 Fairbury Dr
- 347 Huntsman Dr
- 351 Huntsman Dr
- 1485 Perry Jenkins Rd
- 345 Huntsman Dr
- 353 Huntsman Dr
- 346 Huntsman Dr
- 301 Foxhound Ct
- 343 Huntsman Dr
- 355 Huntsman Dr
- 338 Huntsman Dr
- 120 Perry Jenkins Rd
- 302 Foxhound Ct
- 336 Huntsman Dr
- 331 Vixen Blvd
- 303 Foxhound Ct
- 341 Huntsman Dr
- 304 Foxhound Ct
- 339 Huntsman Dr
- 000 Perry Jenkins Rd
- 334 Huntsman Dr