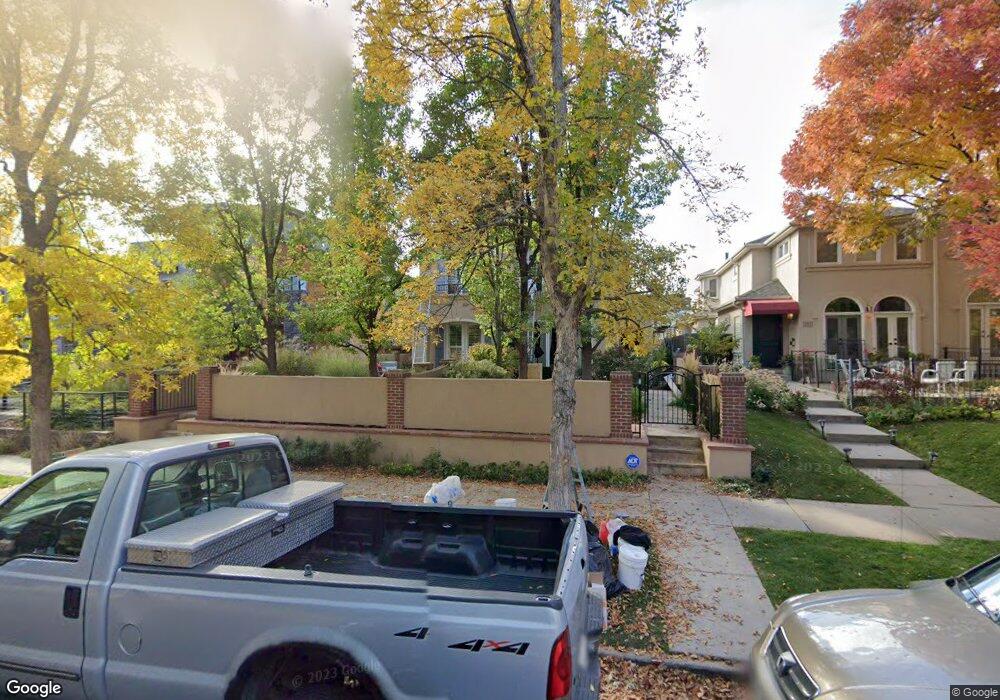
349 Jackson St Denver, CO 80206
Cherry Creek NeighborhoodEstimated Value: $1,323,683 - $1,408,000
3
Beds
4
Baths
3,363
Sq Ft
$406/Sq Ft
Est. Value
About This Home
This home is located at 349 Jackson St, Denver, CO 80206 and is currently estimated at $1,364,421, approximately $405 per square foot. 349 Jackson St is a home located in Denver County with nearby schools including Steck Elementary School, Hill Campus of Arts & Sciences, and George Washington High School.
Ownership History
Date
Name
Owned For
Owner Type
Purchase Details
Closed on
Oct 18, 2021
Sold by
Broyles Katherine L
Bought by
Hirst Harvey L and Joint Traci
Current Estimated Value
Purchase Details
Closed on
May 31, 2016
Sold by
Duval Bruce A
Bought by
Broyles Katherine L
Purchase Details
Closed on
Feb 8, 2002
Sold by
Toney Debra
Bought by
Duval Bruce A
Home Financials for this Owner
Home Financials are based on the most recent Mortgage that was taken out on this home.
Original Mortgage
$520,000
Interest Rate
5.87%
Purchase Details
Closed on
Sep 14, 2000
Sold by
Lamotte Connie Mae
Bought by
Toney Debra and Debra Toney Residential Design & Develop
Home Financials for this Owner
Home Financials are based on the most recent Mortgage that was taken out on this home.
Original Mortgage
$331,500
Interest Rate
8.15%
Create a Home Valuation Report for This Property
The Home Valuation Report is an in-depth analysis detailing your home's value as well as a comparison with similar homes in the area
Home Values in the Area
Average Home Value in this Area
Purchase History
| Date | Buyer | Sale Price | Title Company |
|---|---|---|---|
| Hirst Harvey L | $1,259,000 | Heritage Title Company | |
| Broyles Katherine L | $990,000 | Land Title Guarantee Company | |
| Duval Bruce A | $650,000 | North American Title Co | |
| Toney Debra | $390,000 | Land Title Guarantee Company |
Source: Public Records
Mortgage History
| Date | Status | Borrower | Loan Amount |
|---|---|---|---|
| Previous Owner | Duval Bruce A | $520,000 | |
| Previous Owner | Toney Debra | $331,500 |
Source: Public Records
Tax History
| Year | Tax Paid | Tax Assessment Tax Assessment Total Assessment is a certain percentage of the fair market value that is determined by local assessors to be the total taxable value of land and additions on the property. | Land | Improvement |
|---|---|---|---|---|
| 2025 | $6,722 | $101,280 | $36,840 | $36,840 |
| 2024 | $6,722 | $84,870 | $31,320 | $53,550 |
| 2023 | $6,576 | $84,870 | $31,320 | $53,550 |
| 2022 | $5,931 | $74,580 | $46,400 | $28,180 |
| 2021 | $5,725 | $76,720 | $47,730 | $28,990 |
| 2020 | $4,622 | $62,300 | $39,430 | $22,870 |
| 2019 | $4,493 | $62,300 | $39,430 | $22,870 |
| 2018 | $5,059 | $65,390 | $35,290 | $30,100 |
| 2017 | $5,044 | $65,390 | $35,290 | $30,100 |
| 2016 | $6,078 | $74,530 | $26,825 | $47,705 |
Source: Public Records
Map
Nearby Homes
- 340 Jackson St
- 343 Garfield St
- 345 Harrison St
- 255 Jackson St
- 409 Harrison St Unit 2
- 301 Monroe St
- 467 Harrison St
- 3707 E 5th Ave
- 465 Monroe St
- 420 Colorado Blvd
- 525 Jackson St Unit 304
- 160 Monroe St
- 407 Madison St
- 445 Madison St
- 270 Cook St
- 581 Garfield St
- 3472 E 2nd Ave
- 3330 E 4th Ave
- 207 Cook St
- 78 Jackson St Unit C
- 351 Jackson St
- 343 Jackson St
- 341 Jackson St
- 355 Jackson St
- 357 Jackson St
- 333 Jackson St
- 340 Garfield St
- 335 Jackson St
- 365 Jackson St
- 367 Jackson St
- 327 Jackson St
- 325 Jackson St
- 373 Jackson St
- 374 Garfield St
- 350 Garfield St
- 336 Garfield St
- 352 Garfield St
- 348 Garfield St
- 342 Garfield St
- 358 Garfield St
Your Personal Tour Guide
Ask me questions while you tour the home.