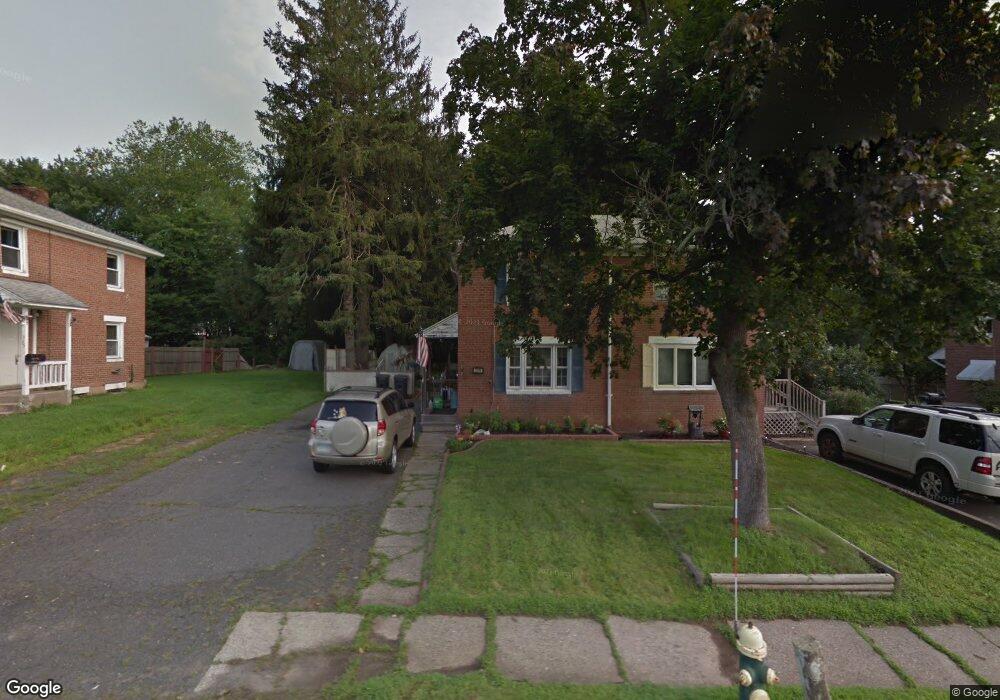
349 Mill St Southington, CT 06489
West Southington NeighborhoodEstimated Value: $202,000 - $245,874
2
Beds
1
Bath
800
Sq Ft
$288/Sq Ft
Est. Value
About This Home
This home is located at 349 Mill St, Southington, CT 06489 and is currently estimated at $230,719, approximately $288 per square foot. 349 Mill St is a home located in Hartford County with nearby schools including Urbin T. Kelley Elementary School, Joseph A. Depaolo Middle School, and Southington High School.
Ownership History
Date
Name
Owned For
Owner Type
Purchase Details
Closed on
Mar 30, 2001
Sold by
Thomas Kelly A
Bought by
Casale Robert J and Casale Geraldine M
Current Estimated Value
Home Financials for this Owner
Home Financials are based on the most recent Mortgage that was taken out on this home.
Original Mortgage
$78,665
Interest Rate
6.96%
Purchase Details
Closed on
Aug 14, 1989
Sold by
Keyworth Valerie
Bought by
Johnston Sharon
Create a Home Valuation Report for This Property
The Home Valuation Report is an in-depth analysis detailing your home's value as well as a comparison with similar homes in the area
Home Values in the Area
Average Home Value in this Area
Purchase History
| Date | Buyer | Sale Price | Title Company |
|---|---|---|---|
| Casale Robert J | $79,900 | -- | |
| Johnston Sharon | $99,000 | -- |
Source: Public Records
Mortgage History
| Date | Status | Borrower | Loan Amount |
|---|---|---|---|
| Open | Johnston Sharon | $124,800 | |
| Closed | Johnston Sharon | $21,000 | |
| Closed | Johnston Sharon | $78,665 | |
| Previous Owner | Johnston Sharon | $47,970 |
Source: Public Records
Tax History Compared to Growth
Tax History
| Year | Tax Paid | Tax Assessment Tax Assessment Total Assessment is a certain percentage of the fair market value that is determined by local assessors to be the total taxable value of land and additions on the property. | Land | Improvement |
|---|---|---|---|---|
| 2025 | $2,562 | $77,150 | $50,900 | $26,250 |
| 2024 | $2,426 | $77,150 | $50,900 | $26,250 |
| 2023 | $2,342 | $77,150 | $50,900 | $26,250 |
| 2022 | $2,247 | $77,150 | $50,900 | $26,250 |
| 2021 | $2,240 | $77,150 | $50,900 | $26,250 |
| 2020 | $2,395 | $78,180 | $51,930 | $26,250 |
| 2019 | $2,395 | $78,180 | $51,930 | $26,250 |
| 2018 | $2,383 | $78,180 | $51,930 | $26,250 |
| 2017 | $2,383 | $78,180 | $51,930 | $26,250 |
| 2016 | $2,317 | $78,180 | $51,930 | $26,250 |
| 2015 | $2,337 | $80,210 | $49,460 | $30,750 |
| 2014 | $2,275 | $80,210 | $49,460 | $30,750 |
Source: Public Records
Map
Nearby Homes