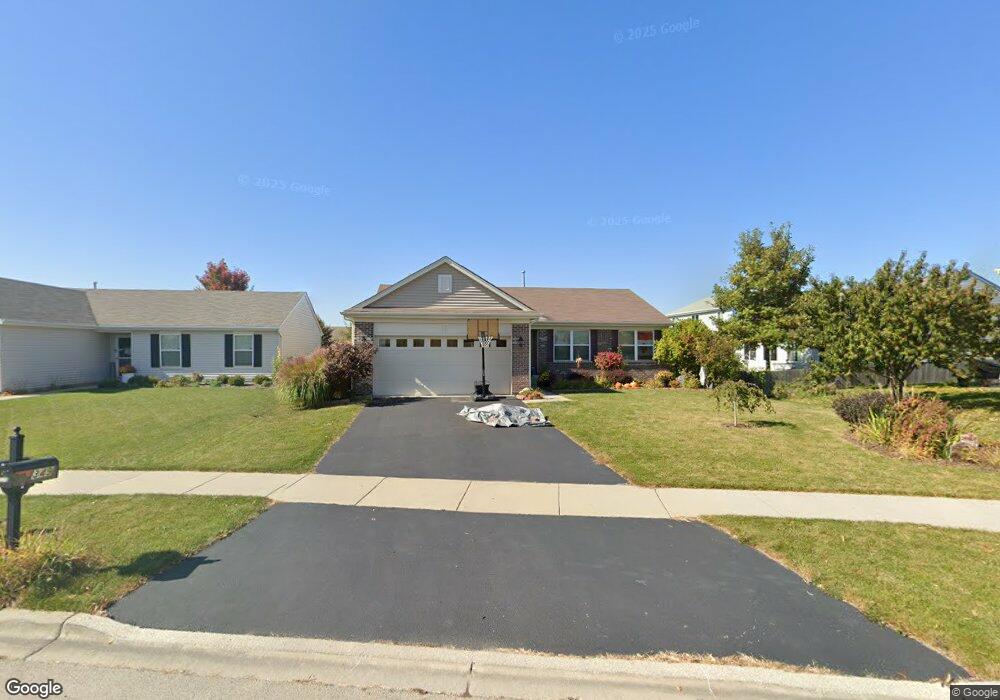
349 N Charles St Cortland, IL 60112
Estimated Value: $278,000 - $348,000
3
Beds
2
Baths
1,350
Sq Ft
$223/Sq Ft
Est. Value
About This Home
This home is located at 349 N Charles St, Cortland, IL 60112 and is currently estimated at $301,054, approximately $223 per square foot. 349 N Charles St is a home located in DeKalb County with nearby schools including Cortland Elementary School, Huntley Middle School, and De Kalb High School.
Ownership History
Date
Name
Owned For
Owner Type
Purchase Details
Closed on
Jan 7, 2023
Sold by
Dylka Joshua A
Bought by
Anderson Laura A
Current Estimated Value
Purchase Details
Closed on
Sep 23, 2011
Sold by
Drh Cambridge Homes Inc
Bought by
Dylka Joshua A and Anderson Laura A
Home Financials for this Owner
Home Financials are based on the most recent Mortgage that was taken out on this home.
Original Mortgage
$148,713
Interest Rate
4.23%
Mortgage Type
New Conventional
Create a Home Valuation Report for This Property
The Home Valuation Report is an in-depth analysis detailing your home's value as well as a comparison with similar homes in the area
Home Values in the Area
Average Home Value in this Area
Purchase History
| Date | Buyer | Sale Price | Title Company |
|---|---|---|---|
| Anderson Laura A | -- | Stewart Title | |
| Dylka Joshua A | $157,000 | -- |
Source: Public Records
Mortgage History
| Date | Status | Borrower | Loan Amount |
|---|---|---|---|
| Previous Owner | Dylka Joshua A | $148,713 |
Source: Public Records
Tax History Compared to Growth
Tax History
| Year | Tax Paid | Tax Assessment Tax Assessment Total Assessment is a certain percentage of the fair market value that is determined by local assessors to be the total taxable value of land and additions on the property. | Land | Improvement |
|---|---|---|---|---|
| 2024 | $7,131 | $65,253 | $13,326 | $51,927 |
| 2023 | $6,591 | $52,265 | $12,467 | $39,798 |
| 2022 | $6,898 | $52,924 | $11,898 | $41,026 |
| 2021 | $4,674 | $50,118 | $11,328 | $38,790 |
| 2020 | $6,820 | $48,555 | $10,975 | $37,580 |
| 2019 | $6,545 | $45,751 | $10,514 | $35,237 |
| 2018 | $3,542 | $36,942 | $9,943 | $26,999 |
| 2017 | $5,535 | $35,170 | $9,466 | $25,704 |
| 2016 | $6,109 | $39,479 | $8,897 | $30,582 |
| 2015 | -- | $37,073 | $8,355 | $28,718 |
| 2014 | -- | $34,547 | $8,041 | $26,506 |
| 2013 | -- | $40,944 | $10,201 | $30,743 |
Source: Public Records
Map
Nearby Homes
- 437 N Charles St Unit 7
- 353 N Aspen Dr
- 347 N Aspen Dr
- 341 N Aspen Dr
- 335 N Aspen Dr
- 329 N Aspen Dr
- 300 N Aspen Dr
- 214 N Aspen Dr
- 42 W Auburndale Ave
- 95 Lots Chestnut Grove
- Lot B5 W Paw Ave
- Lot B6 W Paw Ave
- 94 W Crabapple Ave
- 241 N Somonauk Rd
- Lot C7 Crabapple Ave
- Lot 2 Stonegate
- 86 E Daisy Ave
- LOT E7 W Bluebell Ave
- Lot D7 Bluebell
- 20 W Sandalwood Ave
- 342 N Charles St
- 343 N Charles St
- 337 N Charles St
- 336 N Charles St
- 325 N Charles St
- 319 N Charles St
- 313 N Charles St
- 307 N Charles St
- 306 N Charles St
- 301 N Charles St
- 300 N Charles St
- 295 N Charles St
- 289 N Charles St
- 283 N Charles St
- 2903A Charles St Unit 2903A
- 2903A Charles St
- 2905B Charles St Unit 2905B
- 2905B Charles St
- 405 N Charles St
- 407 N Charles St