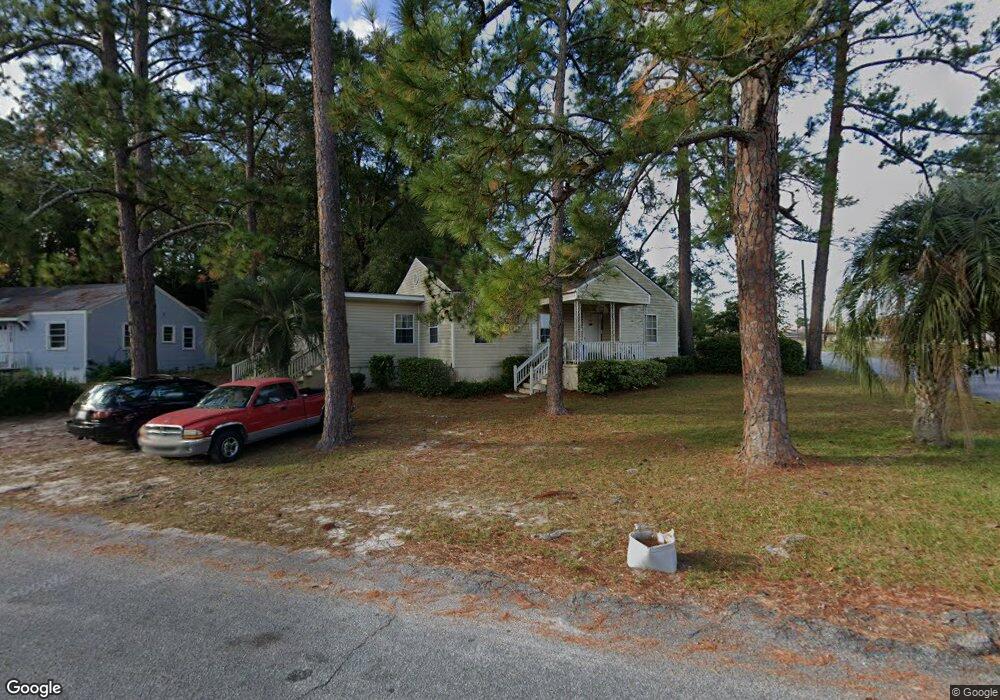
349 Pineview Dr Waycross, GA 31501
Estimated Value: $163,000 - $190,000
3
Beds
2
Baths
1,885
Sq Ft
$92/Sq Ft
Est. Value
About This Home
This home is located at 349 Pineview Dr, Waycross, GA 31501 and is currently estimated at $173,830, approximately $92 per square foot. 349 Pineview Dr is a home located in Ware County with nearby schools including Center Elementary School, Waycross Middle School, and Ware County High School.
Ownership History
Date
Name
Owned For
Owner Type
Purchase Details
Closed on
Dec 10, 1997
Sold by
Sirmons Thelma Mulli
Bought by
Clark Sonya B
Current Estimated Value
Purchase Details
Closed on
Oct 16, 1990
Bought by
Benchoff Robert Ta
Purchase Details
Closed on
Oct 20, 1900
Sold by
Benchoff Robert Ta
Bought by
Sirmons Thelma Mulli
Create a Home Valuation Report for This Property
The Home Valuation Report is an in-depth analysis detailing your home's value as well as a comparison with similar homes in the area
Purchase History
| Date | Buyer | Sale Price | Title Company |
|---|---|---|---|
| Clark Sonya B | $21,000 | -- | |
| Benchoff Robert Ta | $25,000 | -- | |
| Sirmons Thelma Mulli | -- | -- |
Source: Public Records
Tax History Compared to Growth
Tax History
| Year | Tax Paid | Tax Assessment Tax Assessment Total Assessment is a certain percentage of the fair market value that is determined by local assessors to be the total taxable value of land and additions on the property. | Land | Improvement |
|---|---|---|---|---|
| 2025 | $2,178 | $64,475 | $1,300 | $63,175 |
| 2024 | $2,178 | $64,475 | $1,300 | $63,175 |
| 2023 | $2,223 | $46,434 | $15,246 | $31,188 |
| 2022 | $1,850 | $46,434 | $15,246 | $31,188 |
| 2021 | $1,646 | $38,071 | $15,246 | $22,825 |
| 2020 | $1,641 | $37,648 | $15,246 | $22,402 |
| 2019 | $1,667 | $37,701 | $15,246 | $22,455 |
| 2018 | $1,635 | $36,632 | $15,246 | $21,386 |
| 2017 | $1,597 | $36,632 | $15,246 | $21,386 |
| 2016 | $1,597 | $36,632 | $15,246 | $21,386 |
| 2015 | $1,608 | $36,632 | $15,246 | $21,386 |
| 2014 | $1,607 | $36,632 | $15,246 | $21,386 |
| 2013 | -- | $36,632 | $15,246 | $21,386 |
Source: Public Records
Map
Nearby Homes
- 0 Pineview Dr
- 407 Pineview Dr
- 00 Pioneer St
- 2202 Pioneer St
- 2120 Tebeau St
- 1701 Satilla Blvd
- .22 Alice St
- 706 Cherokee Cir
- 2509 Tebeau St
- 804 Cherokee Cir
- 402 Preston St
- 406 Preston St
- 607 Linden Dr
- 2312 Spurgeon St
- 403 Preston St
- 0 Beville St
- 707 Euclid Ave
- 1504 Habersham Dr
- 0 Saint Marys Dr Unit (TRACT 2 0.25 ACRES)
- 601 Community Dr
- 00 Pineview Dr
- 5007 Pineview Dr
- 347 Pineview Dr
- 2016 Alice St
- 345 Pineview Dr
- 401 Pineview Dr
- 2014 Alice St
- 2019 El Jo Sa St
- 356 Pineview Dr
- 2021 El Jo Sa St
- 2017 El Jo Sa St
- 400 Pineview Dr
- 2017 El Josa St
- 403 Pineview Dr
- 2015 El Jo Sa St
- 2012 Alice St
- 2015 El Josa St
- 000 Japonica Ave
- 354 Pineview Dr
- 402 Pineview Dr