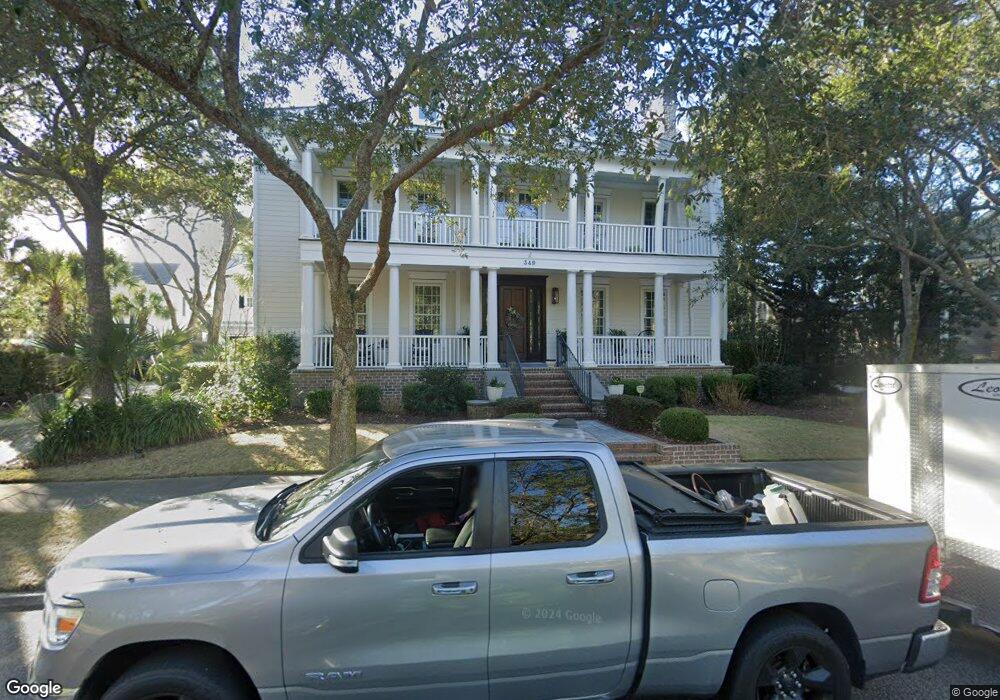
349 Ralston Creek St Daniel Island, SC 29492
Daniel Island NeighborhoodEstimated Value: $3,040,000 - $3,330,000
6
Beds
6
Baths
5,245
Sq Ft
$601/Sq Ft
Est. Value
About This Home
This home is located at 349 Ralston Creek St, Daniel Island, SC 29492 and is currently estimated at $3,153,628, approximately $601 per square foot. 349 Ralston Creek St is a home located in Berkeley County with nearby schools including Daniel Island School and Bishop England High School.
Ownership History
Date
Name
Owned For
Owner Type
Purchase Details
Closed on
Apr 4, 2016
Sold by
Wiltse George D and Wiltse Solange C
Bought by
Wiltse George D and Wiltse Solange C
Current Estimated Value
Purchase Details
Closed on
May 9, 2014
Sold by
Tidelands Bank
Bought by
Wiltse George D and Wiltse Solange C
Purchase Details
Closed on
Apr 27, 2012
Sold by
Kellman F William
Bought by
Tidelands Bank
Purchase Details
Closed on
May 8, 2008
Sold by
Buceti Paul J and Buceti Holly W
Bought by
Kellman F William and The Grassroot Nominee Trust
Home Financials for this Owner
Home Financials are based on the most recent Mortgage that was taken out on this home.
Original Mortgage
$1,312,500
Interest Rate
5.82%
Mortgage Type
Purchase Money Mortgage
Purchase Details
Closed on
Jun 30, 2004
Sold by
Peggra Llc
Bought by
Buceti Ii Paul J and Buceti Holly W
Purchase Details
Closed on
Apr 16, 2003
Sold by
Daniel Island Associates Llc
Bought by
Peggra Llc
Create a Home Valuation Report for This Property
The Home Valuation Report is an in-depth analysis detailing your home's value as well as a comparison with similar homes in the area
Home Values in the Area
Average Home Value in this Area
Purchase History
| Date | Buyer | Sale Price | Title Company |
|---|---|---|---|
| Wiltse George D | -- | -- | |
| Wiltse George D | $1,265,000 | -- | |
| Tidelands Bank | $1,312,500 | -- | |
| Kellman F William | $1,750,000 | -- | |
| Buceti Ii Paul J | $285,000 | -- | |
| Peggra Llc | $145,000 | -- |
Source: Public Records
Mortgage History
| Date | Status | Borrower | Loan Amount |
|---|---|---|---|
| Previous Owner | Kellman F William | $1,312,500 |
Source: Public Records
Tax History Compared to Growth
Tax History
| Year | Tax Paid | Tax Assessment Tax Assessment Total Assessment is a certain percentage of the fair market value that is determined by local assessors to be the total taxable value of land and additions on the property. | Land | Improvement |
|---|---|---|---|---|
| 2025 | $10,498 | $1,673,492 | $430,673 | $1,242,819 |
| 2024 | $10,498 | $66,940 | $17,227 | $49,713 |
| 2023 | $10,498 | $66,940 | $17,227 | $49,713 |
| 2022 | $9,571 | $58,208 | $12,684 | $45,524 |
| 2021 | $9,747 | $58,200 | $12,684 | $45,524 |
| 2020 | $9,946 | $58,208 | $12,684 | $45,524 |
| 2019 | $10,493 | $58,208 | $12,684 | $45,524 |
| 2018 | $9,141 | $50,616 | $11,928 | $38,688 |
| 2017 | $9,126 | $50,616 | $11,928 | $38,688 |
| 2016 | $9,258 | $50,620 | $11,930 | $38,690 |
| 2015 | $8,641 | $50,620 | $11,930 | $38,690 |
| 2014 | $56,101 | $86,710 | $15,980 | $70,730 |
| 2013 | -- | $86,710 | $15,980 | $70,730 |
Source: Public Records
Map
Nearby Homes
- 136 Iron Bottom Ln
- 207 Ferryman Ln
- 462 Creek Landing St
- 401 Ralston Creek St
- 331 Simone Dr Unit Lot 50
- 323 Simone Dr Unit Lot 48
- 319 Simone Dr Unit Lot 47
- 347 Simone Dr Unit Lot 54
- 117 Etta Way
- 343 Simone Dr Unit Lot 53
- 115 Etta Way
- 113 Etta Way
- 138 Fairbanks Dr
- 142 Fairbanks Dr
- 140 Fairbanks Dr
- 109 Etta Way
- 107 Etta Way
- 105 Etta Way
- 412 Wayfaring Point
- 720 Island Park Dr Unit 104
- 343 Ralston Creek St
- 304 Gunboat Ln
- 308 Gunboat Ln
- 357 Ralston Creek St
- 333 Ralston Creek St
- 137 Iron Bottom Ln
- 312 Gunboat Ln
- 354 Ralston Creek St
- 350 Ralston Creek St
- 358 Ralston Creek St
- 301 Gunboat Ln
- 305 Gunboat Ln
- 334 Ralston Creek St
- 346 Ralston Creek St
- 327 Ralston Creek St
- 309 Gunboat Ln
- 313 Gunboat Ln
- 330 Ralston Creek St
- 218 Ferryman Ln
- 323 Ralston Creek St