
Seller's Agent in 2021
Brandon Adams
Better Properties Gig Harbor
(360) 621-6186
31 Total Sales
Estimated Value: $472,000 - $625,000
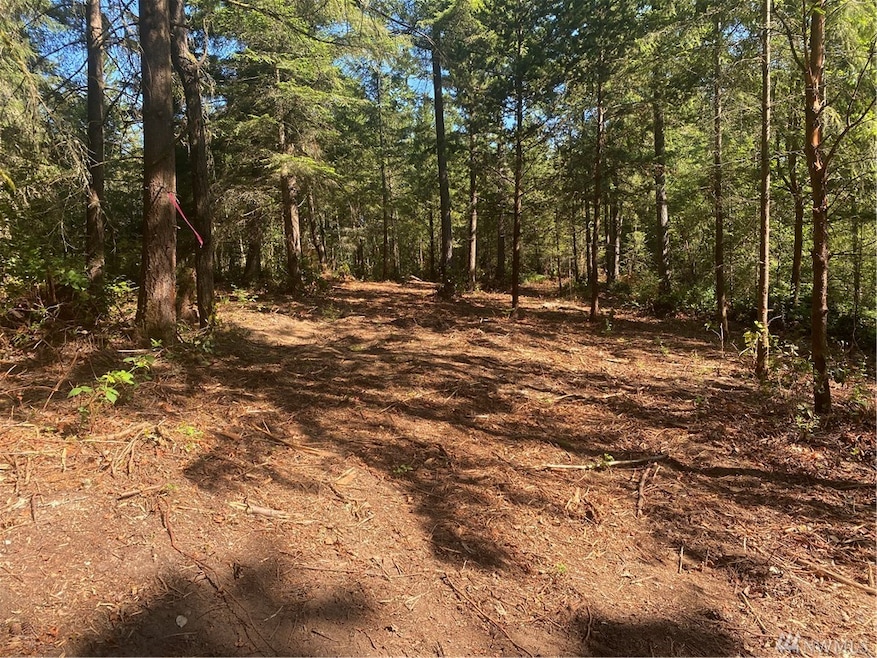
This home is located at 349 SW Ragle Ct, Port Orchard, WA 98367 since 29 July 2021 and is currently estimated at $525,341. 349 SW Ragle Ct is a home located in Kitsap County with nearby schools including Burley Glenwood Elementary School, Cedar Heights Middle School, and South Kitsap High School.
Last Agent to Sell the Property
Better Properties Gig Harbor License #106416 Listed on: 07/29/2021
Source: Northwest Multiple Listing Service (NWMLS)
MLS#: NWM1817510
| Date | Buyer | Sale Price | Title Company |
|---|---|---|---|
| Heilinger James | $209,000 | Land Ttl Co Silverdale Submi | |
| Advantage Construction Llc | $131,000 | Land Ttl Co Silverdale Submi |
| Date | Event | Price | Change | Sq Ft Price |
|---|---|---|---|---|
| 07/29/2021 07/29/21 | Sold | $209,000 | 0.0% | -- |
| 07/29/2021 07/29/21 | For Sale | $209,000 | -- | -- |
| Year | Tax Paid | Tax Assessment Tax Assessment Total Assessment is a certain percentage of the fair market value that is determined by local assessors to be the total taxable value of land and additions on the property. | Land | Improvement |
|---|---|---|---|---|
| 2026 | $3,617 | $409,900 | $93,630 | $316,270 |
| 2025 | $3,617 | $326,890 | $93,630 | $233,260 |
| 2024 | $2,825 | $326,890 | $93,630 | $233,260 |
| 2023 | $768 | $93,630 | $93,630 | $0 |
| 2022 | $731 | $74,640 | $74,640 | $0 |
| 2021 | $703 | $67,850 | $67,850 | $0 |
| 2020 | $708 | $66,290 | $66,290 | $0 |
| 2019 | $595 | $61,270 | $61,270 | $0 |
| 2018 | $646 | $52,730 | $52,730 | $0 |
| 2017 | $565 | $52,730 | $52,730 | $0 |
| 2016 | $589 | $50,220 | $50,220 | $0 |
| 2015 | $581 | $50,220 | $50,220 | $0 |
| 2014 | -- | $52,990 | $52,990 | $0 |
| 2013 | -- | $52,990 | $52,990 | $0 |
Seller's Agent in 2021
Brandon Adams
Better Properties Gig Harbor
(360) 621-6186
31 Total Sales
Buyer's Agent in 2021
Justin Weis
Paramount Real Estate Group
(509) 304-5340
148 Total Sales
Source: Northwest Multiple Listing Service (NWMLS)
MLS Number: NWM1817510
APN: 352301-3-029-2008
Disclaimer: Certain information contained herein is derived from information provided by parties other than Homes.com. All information provided is deemed reliable, but is not guaranteed to be accurate and should be independently verified.
![]() All data is obtained from various sources and may not have been verified by broker or MLS GRID. Supplied Open House Information is subject to change without notice. All information should be independently reviewed and verified for accuracy. Properties may or may not be listed by the office/agent presenting the information. Listing information is provided by the Northwest Multiple Listing Service (NWMLS). Property information is based on available data that may include MLS information, county records, and other sources. Listings marked with the 3 tree icon and provided by NWMLS. All properties are subject to prior sale or withdrawal. IDX information is provided exclusively for consumers’ personal noncommercial use, that it may not be used for any purpose other than to identify prospective properties consumers may be interested in purchasing, that the data is deemed reliable but is not guaranteed by MLS GRID. ©2025 NWMLS.
All data is obtained from various sources and may not have been verified by broker or MLS GRID. Supplied Open House Information is subject to change without notice. All information should be independently reviewed and verified for accuracy. Properties may or may not be listed by the office/agent presenting the information. Listing information is provided by the Northwest Multiple Listing Service (NWMLS). Property information is based on available data that may include MLS information, county records, and other sources. Listings marked with the 3 tree icon and provided by NWMLS. All properties are subject to prior sale or withdrawal. IDX information is provided exclusively for consumers’ personal noncommercial use, that it may not be used for any purpose other than to identify prospective properties consumers may be interested in purchasing, that the data is deemed reliable but is not guaranteed by MLS GRID. ©2025 NWMLS.
Based on information submitted to the MLS GRID