Estimated Value: $790,000 - $948,000
3
Beds
2
Baths
3,754
Sq Ft
$227/Sq Ft
Est. Value
About This Home
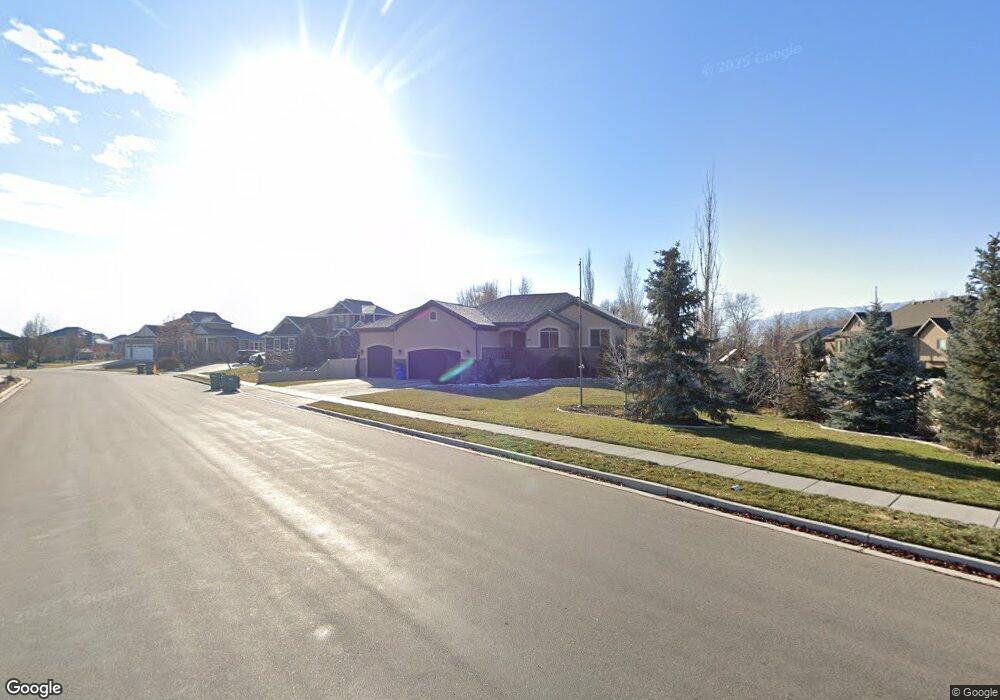
This home is located at 349 W 850 S, Lehi, UT 84043 and is currently estimated at $851,977, approximately $226 per square foot. 349 W 850 S is a home located in Utah County with nearby schools including Meadow Elementary School, Lehi Junior High School, and Lehi High School.
Ownership History
Date
Name
Owned For
Owner Type
Purchase Details
Closed on
Sep 5, 2017
Sold by
Foster Christopher C and Foster Mikelle K
Bought by
Foster Christopher C and Foster Mikelle K
Current Estimated Value
Purchase Details
Closed on
Jul 23, 2012
Sold by
Foster Chris C and Foster Mikelle K
Bought by
Foster Christopher C and Foster Mikelle K
Home Financials for this Owner
Home Financials are based on the most recent Mortgage that was taken out on this home.
Original Mortgage
$289,500
Outstanding Balance
$199,648
Interest Rate
3.65%
Mortgage Type
New Conventional
Estimated Equity
$652,329
Purchase Details
Closed on
Apr 20, 2010
Sold by
Boyer Homes L C
Bought by
Foster Chris C and Foster Mikelle K
Home Financials for this Owner
Home Financials are based on the most recent Mortgage that was taken out on this home.
Original Mortgage
$295,548
Interest Rate
4.94%
Mortgage Type
FHA
Create a Home Valuation Report for This Property
The Home Valuation Report is an in-depth analysis detailing your home's value as well as a comparison with similar homes in the area
Home Values in the Area
Average Home Value in this Area
Purchase History
| Date | Buyer | Sale Price | Title Company |
|---|---|---|---|
| Foster Christopher C | -- | None Available | |
| Foster Christopher C | -- | Cottonwood Titleins | |
| Foster Chris C | -- | Keystone Title Insurance Ag | |
| Boyer Homes L C | -- | Accommodation |
Source: Public Records
Mortgage History
| Date | Status | Borrower | Loan Amount |
|---|---|---|---|
| Open | Foster Christopher C | $289,500 | |
| Closed | Boyer Homes L C | $295,548 |
Source: Public Records
Tax History Compared to Growth
Tax History
| Year | Tax Paid | Tax Assessment Tax Assessment Total Assessment is a certain percentage of the fair market value that is determined by local assessors to be the total taxable value of land and additions on the property. | Land | Improvement |
|---|---|---|---|---|
| 2025 | $3,442 | $448,910 | $340,500 | $475,700 |
| 2024 | $3,218 | $402,820 | $0 | $0 |
| 2023 | $3,218 | $408,925 | $0 | $0 |
| 2022 | $3,434 | $423,005 | $0 | $0 |
| 2021 | $3,044 | $566,900 | $197,000 | $369,900 |
| 2020 | $2,869 | $528,100 | $182,400 | $345,700 |
| 2019 | $2,524 | $483,000 | $182,400 | $300,600 |
| 2018 | $2,483 | $449,200 | $178,000 | $271,200 |
| 2017 | $2,427 | $233,420 | $0 | $0 |
| 2016 | $2,393 | $213,510 | $0 | $0 |
| 2015 | $2,399 | $203,225 | $0 | $0 |
| 2014 | $2,271 | $191,235 | $0 | $0 |
Source: Public Records
Map
Nearby Homes
- 736 S 300 W
- 911 S Chappel Valley Loop
- 1812 N Lake Rd
- 743 S 560 W
- 652 S 500 W
- 453 S 230 W
- 772 W 700 S
- 1204 S 50 E Unit 1
- 672 S 780 W
- 798 S 925 W
- 285 S 660 W
- 773 S 350 E
- 793 S 350 E
- 464 E 800 S
- Adagio Plan at Grandeur Estates
- Ballad Plan at Grandeur Estates
- Interlude Plan at Grandeur Estates
- Trio Plan at Grandeur Estates
- Forte Plan at Grandeur Estates
- Tenor Plan at Grandeur Estates
- 337 W Lehi Ranch Rd Unit LR 137
- 337 W Lehi Ranch Rd
- 899 S 450 W
- 875 S 450 W
- 319 W Lehi Ranch Rd
- 927 S 450 W
- 853 S 450 W
- 348 W Lehi Ranch Rd
- 334 W 850 S
- 924 S 300 W
- 318 W 850 S
- 831 S 350 W
- 946 S 300 W
- 838 S 350 W Unit LR 121
- 284 W Lehi Ranch Rd
- 876 S 450 W
- 892 S 450 W Unit 130
- 892 S 450 W
- 287 W Lehi Ranch Rd Unit LR 139
- 924 S 450 W