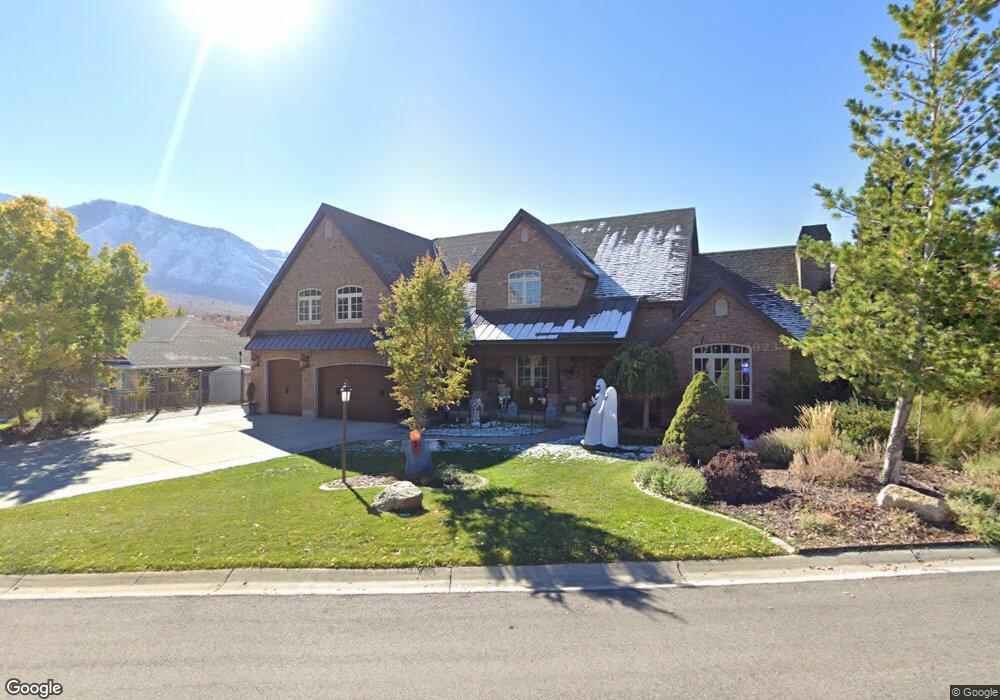
349 W Haleys Lookout Payson, UT 84651
Estimated Value: $890,000 - $1,032,756
6
Beds
6
Baths
3,342
Sq Ft
$294/Sq Ft
Est. Value
About This Home
This home is located at 349 W Haleys Lookout, Payson, UT 84651 and is currently estimated at $980,939, approximately $293 per square foot. 349 W Haleys Lookout is a home located in Utah County with nearby schools including Foothills Elementary School, Valley View Middle School, and Salem Junior High School.
Ownership History
Date
Name
Owned For
Owner Type
Purchase Details
Closed on
May 21, 2016
Sold by
Johnson Kevin and Johnson Nicole B
Bought by
Johnson Kevin A and Johnson Nicole B
Current Estimated Value
Home Financials for this Owner
Home Financials are based on the most recent Mortgage that was taken out on this home.
Original Mortgage
$447,500
Outstanding Balance
$197,791
Interest Rate
3.59%
Mortgage Type
New Conventional
Estimated Equity
$783,148
Purchase Details
Closed on
May 22, 1997
Sold by
Mecham Development Inc
Bought by
Johnson Kevin and Johnson Nicole B
Home Financials for this Owner
Home Financials are based on the most recent Mortgage that was taken out on this home.
Original Mortgage
$61,440
Interest Rate
8.14%
Mortgage Type
Balloon
Create a Home Valuation Report for This Property
The Home Valuation Report is an in-depth analysis detailing your home's value as well as a comparison with similar homes in the area
Home Values in the Area
Average Home Value in this Area
Purchase History
| Date | Buyer | Sale Price | Title Company |
|---|---|---|---|
| Johnson Kevin A | -- | First American | |
| Johnson Kevin | -- | -- |
Source: Public Records
Mortgage History
| Date | Status | Borrower | Loan Amount |
|---|---|---|---|
| Open | Johnson Kevin A | $447,500 | |
| Closed | Johnson Kevin | $61,440 |
Source: Public Records
Tax History Compared to Growth
Tax History
| Year | Tax Paid | Tax Assessment Tax Assessment Total Assessment is a certain percentage of the fair market value that is determined by local assessors to be the total taxable value of land and additions on the property. | Land | Improvement |
|---|---|---|---|---|
| 2025 | $4,649 | $1,004,800 | $263,600 | $741,200 |
| 2024 | $4,649 | $477,675 | $0 | $0 |
| 2023 | $4,502 | $463,815 | $0 | $0 |
| 2022 | $4,788 | $485,485 | $0 | $0 |
| 2021 | $4,074 | $638,800 | $174,700 | $464,100 |
| 2020 | $3,960 | $602,500 | $151,900 | $450,600 |
| 2019 | $3,854 | $597,600 | $147,000 | $450,600 |
| 2018 | $3,595 | $533,900 | $142,100 | $391,800 |
| 2017 | $3,157 | $250,250 | $0 | $0 |
| 2016 | $3,050 | $235,950 | $0 | $0 |
| 2015 | $2,761 | $209,385 | $0 | $0 |
| 2014 | $2,676 | $204,050 | $0 | $0 |
Source: Public Records
Map
Nearby Homes
- 135 W Cove Dr
- 53 High Sierra Dr S
- 107 W High Sierra Dr
- 65 W Coleys Cove
- 85 N Parkside Loop
- 94 W Hillside Dr
- 142 W Parkside Loop
- 288 S Hillside Dr
- 93 E Park Dr
- 75 S Astor Ln
- 51 E Magellan Ln
- 415 N Columbus Ln
- 300 E Magellan Ln
- 364 E Ocampo Ln
- 223 W Goosenest Dr
- 183 Ama Fille Ln N
- 359 E Magellan Ln N
- 764 N Burke Ln
- 650 E Bridger Ln
- 319 N Loafer Canyon Rd
- 368 W Haleys Lookout
- 341 W Hayleys Lookout St
- 341 W Hayleys Lookout St Unit 10
- 383 W Hayleys Lookout St Unit 2
- 323 W Haleys Lookout
- 323 W Haleys Lookout Unit 1
- 368 W Hayleys Lookout
- 342 W Haleys Lookout
- 384 W Haleys Lookout Unit 2
- 312 W Haleys Lookout
- 285 W High Sierra Dr
- 348 S Elk Ridge Dr
- 402 W Haleys Lookout
- 403 W Haleys Lookout
- 348 S Elk Ridge Dr
- 381 S Elk Ridge Dr
- 381 Elk Ridge Dr
- 382 W Haleys Lookout
- 263 W High Sierra Dr
- 361 Elk Ridge Dr