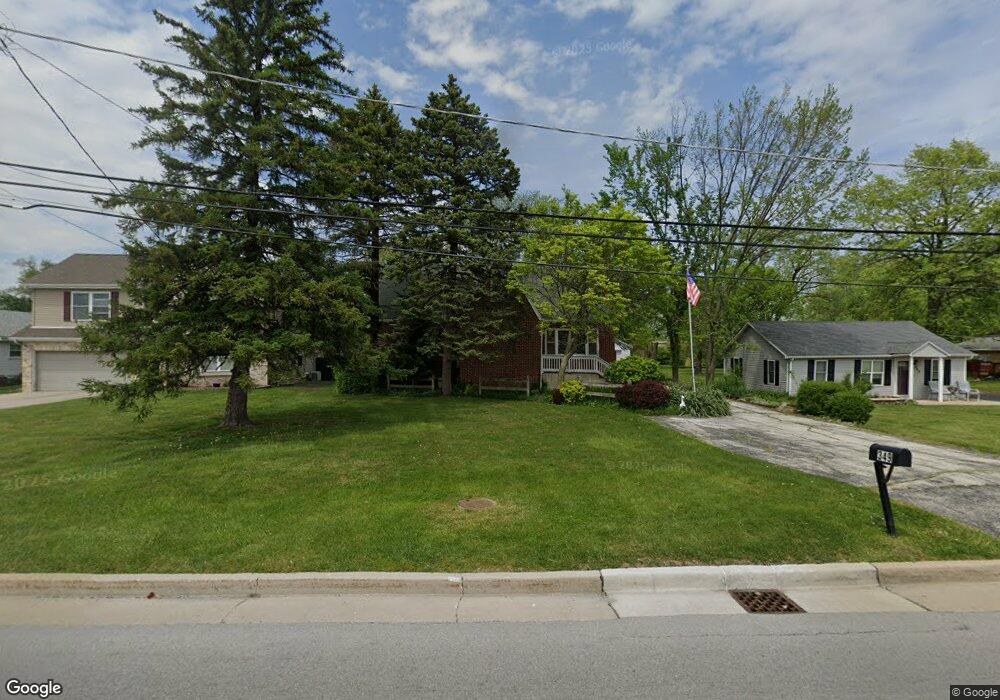
349 W Joe Orr Rd Chicago Heights, IL 60411
West End NeighborhoodEstimated Value: $197,000 - $240,000
4
Beds
2
Baths
1,305
Sq Ft
$172/Sq Ft
Est. Value
About This Home
This home is located at 349 W Joe Orr Rd, Chicago Heights, IL 60411 and is currently estimated at $223,917, approximately $171 per square foot. 349 W Joe Orr Rd is a home located in Cook County with nearby schools including Serena Hills Elementary School, Parker Junior High School, and Homewood-Flossmoor High School.
Ownership History
Date
Name
Owned For
Owner Type
Purchase Details
Closed on
Apr 2, 2002
Sold by
Lueder Thomas G
Bought by
Lueder Joyce K
Current Estimated Value
Home Financials for this Owner
Home Financials are based on the most recent Mortgage that was taken out on this home.
Original Mortgage
$67,200
Interest Rate
6.95%
Mortgage Type
Purchase Money Mortgage
Purchase Details
Closed on
Mar 29, 2002
Sold by
Zener Pamela L
Bought by
Lueder Joyce K
Home Financials for this Owner
Home Financials are based on the most recent Mortgage that was taken out on this home.
Original Mortgage
$67,200
Interest Rate
6.95%
Mortgage Type
Purchase Money Mortgage
Purchase Details
Closed on
Mar 28, 2002
Sold by
Lueder Daniel J
Bought by
Lueder Joyce K
Home Financials for this Owner
Home Financials are based on the most recent Mortgage that was taken out on this home.
Original Mortgage
$67,200
Interest Rate
6.95%
Mortgage Type
Purchase Money Mortgage
Purchase Details
Closed on
Mar 25, 2002
Sold by
Jones Janice S
Bought by
Lueder Joyce K
Home Financials for this Owner
Home Financials are based on the most recent Mortgage that was taken out on this home.
Original Mortgage
$67,200
Interest Rate
6.95%
Mortgage Type
Purchase Money Mortgage
Create a Home Valuation Report for This Property
The Home Valuation Report is an in-depth analysis detailing your home's value as well as a comparison with similar homes in the area
Home Values in the Area
Average Home Value in this Area
Purchase History
| Date | Buyer | Sale Price | Title Company |
|---|---|---|---|
| Lueder Joyce K | $17,000 | -- | |
| Lueder Joyce K | $17,000 | -- | |
| Lueder Joyce K | -- | -- | |
| Lueder Joyce K | -- | -- |
Source: Public Records
Mortgage History
| Date | Status | Borrower | Loan Amount |
|---|---|---|---|
| Previous Owner | Lueder Joyce K | $67,200 |
Source: Public Records
Tax History Compared to Growth
Tax History
| Year | Tax Paid | Tax Assessment Tax Assessment Total Assessment is a certain percentage of the fair market value that is determined by local assessors to be the total taxable value of land and additions on the property. | Land | Improvement |
|---|---|---|---|---|
| 2024 | $6,540 | $17,991 | $9,991 | $8,000 |
| 2023 | $3,031 | $19,221 | $11,221 | $8,000 |
| 2022 | $3,031 | $11,181 | $9,757 | $1,424 |
| 2021 | $3,127 | $11,180 | $9,757 | $1,423 |
| 2020 | $3,235 | $11,180 | $9,757 | $1,423 |
| 2019 | $3,380 | $11,891 | $8,781 | $3,110 |
| 2018 | $3,237 | $11,891 | $8,781 | $3,110 |
| 2017 | $3,141 | $11,891 | $8,781 | $3,110 |
| 2016 | $3,436 | $10,554 | $7,805 | $2,749 |
| 2015 | $4,313 | $10,554 | $7,805 | $2,749 |
| 2014 | $4,209 | $10,554 | $7,805 | $2,749 |
| 2013 | $4,748 | $12,601 | $7,805 | $4,796 |
Source: Public Records
Map
Nearby Homes
- 444 Wood St
- 419 Longwood Dr
- 733 Ashland Ave
- 528 W Winchester Rd
- 531 W Winchester Rd
- 420 Carey Ct
- 246 Vollmer Rd Unit B2
- 417 Westgate Ave
- 226 Cove Dr
- 613 Saratoga Dr
- 213 Cove Dr
- 879 Campbell Ave
- 818 Thomas St
- 156 Kingston Place
- 258 W Highland Dr
- 823 Bradoc St
- 220 Westgate Ave
- 251 W 10th St
- 270 W 10th St
- 634 Lexington Dr
- 353 W Joe Orr Rd
- 341 W Joe Orr Rd
- 357 W Joe Orr Rd
- 361 W Joe Orr Rd
- 337 W Joe Orr Rd
- 333 W Joe Orr Rd
- 369 W Joe Orr Rd
- 329 W Joe Orr Rd
- 373 W Joe Orr Rd
- 325 W Joe Orr Rd
- 529 Wood St
- 321 W Joe Orr Rd
- 519 Wood St
- 356 202nd St
- 360 202nd St
- 317 W Joe Orr Rd
- 513 Wood St
- 459 W Joe Orr Rd
- 368 202nd St
- 320 202nd St Unit 102