Estimated Value: $422,000 - $441,000
4
Beds
2
Baths
1,856
Sq Ft
$232/Sq Ft
Est. Value
About This Home
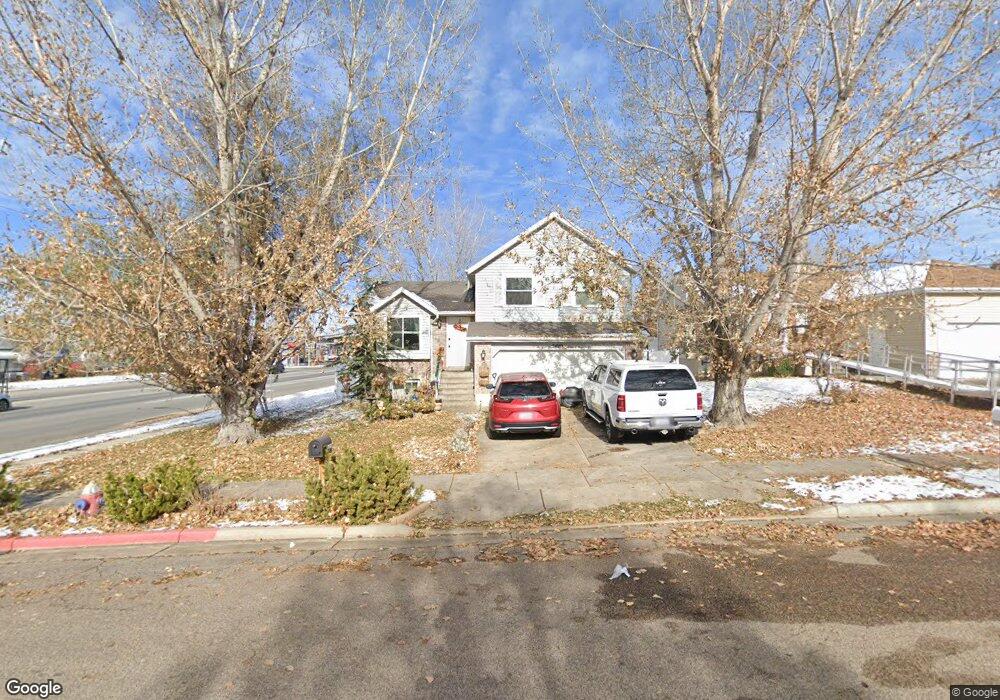
This home is located at 3490 W 4825 S, Roy, UT 84067 and is currently estimated at $430,147, approximately $231 per square foot. 3490 W 4825 S is a home located in Weber County with nearby schools including Midland School, Sand Ridge Junior High School, and Roy High School.
Ownership History
Date
Name
Owned For
Owner Type
Purchase Details
Closed on
Nov 6, 2009
Sold by
Carter Karen A
Bought by
Carter Jeffrey L and Carter Karen A
Current Estimated Value
Home Financials for this Owner
Home Financials are based on the most recent Mortgage that was taken out on this home.
Original Mortgage
$166,920
Outstanding Balance
$109,104
Interest Rate
5.02%
Mortgage Type
FHA
Estimated Equity
$321,043
Purchase Details
Closed on
Oct 30, 2009
Sold by
Nigbur Dave
Bought by
Carter Karen A
Home Financials for this Owner
Home Financials are based on the most recent Mortgage that was taken out on this home.
Original Mortgage
$166,920
Outstanding Balance
$109,104
Interest Rate
5.02%
Mortgage Type
FHA
Estimated Equity
$321,043
Purchase Details
Closed on
Feb 6, 2009
Sold by
Biskey Aron and Biskey Jennifer
Bought by
Nigbur Dave
Purchase Details
Closed on
Mar 23, 2004
Sold by
Hall Theo V and Hall Connie B
Bought by
Biskey Aron and Biskey Jennifer
Home Financials for this Owner
Home Financials are based on the most recent Mortgage that was taken out on this home.
Original Mortgage
$98,450
Interest Rate
6.37%
Mortgage Type
Stand Alone First
Create a Home Valuation Report for This Property
The Home Valuation Report is an in-depth analysis detailing your home's value as well as a comparison with similar homes in the area
Home Values in the Area
Average Home Value in this Area
Purchase History
| Date | Buyer | Sale Price | Title Company |
|---|---|---|---|
| Carter Jeffrey L | -- | Equity Title West Jordan-Jor | |
| Carter Karen A | -- | Equity Title West Jordan-Jor | |
| Nigbur Dave | $117,500 | None Available | |
| Biskey Aron | -- | Mountain View Title |
Source: Public Records
Mortgage History
| Date | Status | Borrower | Loan Amount |
|---|---|---|---|
| Open | Carter Karen A | $166,920 | |
| Previous Owner | Biskey Aron | $98,450 | |
| Closed | Biskey Aron | $24,600 |
Source: Public Records
Tax History Compared to Growth
Tax History
| Year | Tax Paid | Tax Assessment Tax Assessment Total Assessment is a certain percentage of the fair market value that is determined by local assessors to be the total taxable value of land and additions on the property. | Land | Improvement |
|---|---|---|---|---|
| 2025 | $2,503 | $394,690 | $119,964 | $274,726 |
| 2024 | $2,442 | $213,399 | $65,986 | $147,413 |
| 2023 | $2,402 | $210,650 | $59,863 | $150,787 |
| 2022 | $2,523 | $228,800 | $54,904 | $173,896 |
| 2021 | $2,004 | $297,000 | $71,861 | $225,139 |
| 2020 | $1,960 | $268,000 | $71,861 | $196,139 |
| 2019 | $1,883 | $242,000 | $39,858 | $202,142 |
| 2018 | $1,729 | $208,000 | $35,288 | $172,712 |
| 2017 | $1,588 | $178,000 | $37,944 | $140,056 |
| 2016 | $1,607 | $97,471 | $21,130 | $76,341 |
| 2015 | $1,394 | $85,566 | $21,130 | $64,436 |
| 2014 | $1,317 | $79,324 | $21,130 | $58,194 |
Source: Public Records
Map
Nearby Homes
- 3512 W 4835 S Unit 24
- 3517 W 4835 S Unit 27
- 3509 W 4835 S Unit 26
- 3652 W 4625 S
- 3692 W 4625 S
- 3434 W 4525 S
- 4510 Stone Creek Rd Unit F
- 4491 Haven Creek Rd Unit A
- 3443 W 5200 S Unit 2&3
- 3610 W 4475 S
- 3793 W 4475 S
- 3077 W 4650 S
- 4645 S 3950 W
- 3766 W 5300 S
- 4322 S 3450 W
- 4024 W 4650 S
- 5009 S 2925 W
- 4635 S 2950 W
- 4891 S 2875 W
- 5321 S 3100 W