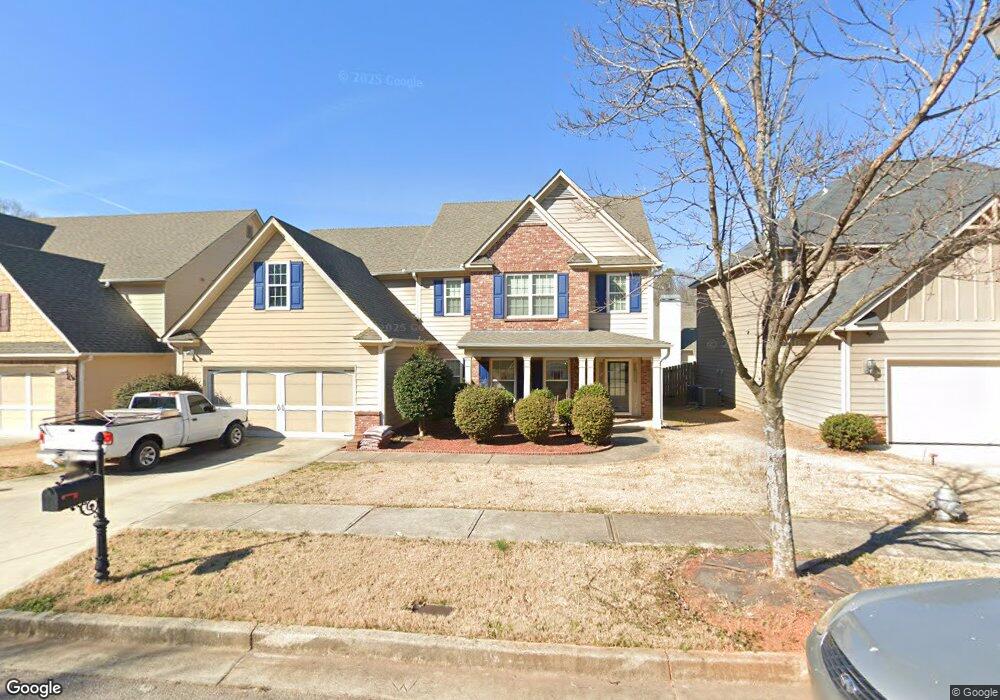
3491 Rosegate Way Snellville, GA 30039
Estimated Value: $378,000 - $472,000
4
Beds
3
Baths
2,826
Sq Ft
$151/Sq Ft
Est. Value
About This Home
This home is located at 3491 Rosegate Way, Snellville, GA 30039 and is currently estimated at $425,697, approximately $150 per square foot. 3491 Rosegate Way is a home located in Gwinnett County with nearby schools including Norton Elementary School, Snellville Middle School, and South Gwinnett High School.
Ownership History
Date
Name
Owned For
Owner Type
Purchase Details
Closed on
Apr 30, 2010
Sold by
Hud & Housing Of Urban Dev
Bought by
Brown Tremaine
Current Estimated Value
Home Financials for this Owner
Home Financials are based on the most recent Mortgage that was taken out on this home.
Original Mortgage
$149,979
Outstanding Balance
$101,951
Interest Rate
5.5%
Mortgage Type
FHA
Estimated Equity
$323,746
Purchase Details
Closed on
Dec 1, 2009
Sold by
Wells Fargo Bk Na
Bought by
Hud-Housing Of Urban Dev
Purchase Details
Closed on
Sep 30, 2008
Sold by
Meridian Hms Of Woodgate Landi
Bought by
Lyon Brian D
Home Financials for this Owner
Home Financials are based on the most recent Mortgage that was taken out on this home.
Original Mortgage
$192,496
Interest Rate
6.45%
Mortgage Type
FHA
Create a Home Valuation Report for This Property
The Home Valuation Report is an in-depth analysis detailing your home's value as well as a comparison with similar homes in the area
Home Values in the Area
Average Home Value in this Area
Purchase History
| Date | Buyer | Sale Price | Title Company |
|---|---|---|---|
| Brown Tremaine | $143,800 | -- | |
| Hud-Housing Of Urban Dev | -- | -- | |
| Wells Fargo Bk Na | $201,081 | -- | |
| Lyon Brian D | $196,000 | -- |
Source: Public Records
Mortgage History
| Date | Status | Borrower | Loan Amount |
|---|---|---|---|
| Open | Brown Tremaine | $149,979 | |
| Previous Owner | Lyon Brian D | $192,496 |
Source: Public Records
Tax History Compared to Growth
Tax History
| Year | Tax Paid | Tax Assessment Tax Assessment Total Assessment is a certain percentage of the fair market value that is determined by local assessors to be the total taxable value of land and additions on the property. | Land | Improvement |
|---|---|---|---|---|
| 2025 | $6,623 | $178,240 | $30,000 | $148,240 |
| 2024 | $6,320 | $167,760 | $30,000 | $137,760 |
| 2023 | $6,320 | $158,960 | $29,680 | $129,280 |
| 2022 | $5,278 | $139,360 | $22,000 | $117,360 |
| 2021 | $3,743 | $94,680 | $14,000 | $80,680 |
| 2020 | $3,658 | $91,760 | $14,000 | $77,760 |
| 2019 | $3,525 | $91,760 | $14,000 | $77,760 |
| 2018 | $3,250 | $84,440 | $14,000 | $70,440 |
| 2016 | $2,768 | $70,200 | $12,000 | $58,200 |
| 2015 | $2,673 | $66,680 | $12,000 | $54,680 |
| 2014 | -- | $66,680 | $12,000 | $54,680 |
Source: Public Records
Map
Nearby Homes
- 3331 Glen Summit Ln
- 4567 Eon Ct
- 3516 Iron Hearth Bend Unit 98C
- 3516 Iron Hearth Bend
- 3527 Iron Hearth Bend
- 3527 Iron Hearth Bend Unit 112A
- 3526 Iron Hearth Bend Unit 97C
- 3526 Iron Hearth Bend
- 3537 Iron Hearth Bend Unit 111A
- 3537 Iron Hearth Bend
- 3536 Iron Hearth Bend
- 3536 Iron Hearth Bend Unit 96C
- 3547 Iron Hearth Bend Unit 110A
- 3547 Iron Hearth Bend
- 3546 Iron Hearth Bend Unit 95C
- 3546 Iron Hearth Bend
- 3557 Iron Hearth Bend Unit 109C
- 3557 Iron Hearth Bend
- 3556 Iron Hearth Bend
- 3556 Iron Hearth Bend Unit 94C
- 3481 Rosegate Way
- 3481 Rosegate Way Unit 11 B
- 3501 Rosegate Way
- 3494 Pinegate Trail
- 3484 Pinegate Trail
- 3471 Rosegate Way Unit 10 B
- 3492 Rosegate Way Unit 27
- 3492 Rosegate Way
- 3474 Pinegate Trail Unit 5 B
- 3474 Pinegate Trail
- 3482 Rosegate Way Unit 26 A
- 3482 Rosegate Way
- 3461 Rosegate Way Unit 9 B
- 3472 Rosegate Way Unit 25 A
- 3472 Rosegate Way
- 4481 Rosegate Dr
- 4471 Rosegate Dr
- 3464 Pinegate Trail
- 3504 Pinegate Trail
- 4491 Rosegate Dr