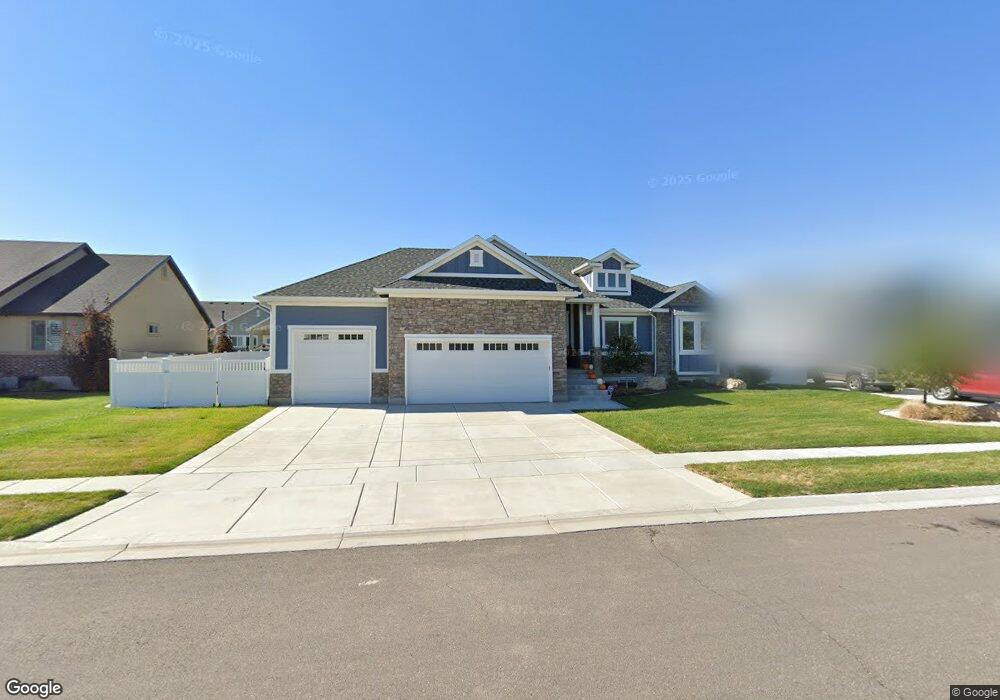
3491 S 4825 W Unit 16 West Haven, UT 84401
Estimated Value: $600,000 - $697,000
3
Beds
3
Baths
3,428
Sq Ft
$194/Sq Ft
Est. Value
About This Home
This home is located at 3491 S 4825 W Unit 16, West Haven, UT 84401 and is currently estimated at $663,545, approximately $193 per square foot. 3491 S 4825 W Unit 16 is a home located in Weber County with nearby schools including Country View School, Rocky Mountain Junior High School, and Fremont High School.
Ownership History
Date
Name
Owned For
Owner Type
Purchase Details
Closed on
Dec 24, 2019
Sold by
Toner Eric and Toner Tiffany
Bought by
Toner Eric R and Toner Tiffany Y
Current Estimated Value
Home Financials for this Owner
Home Financials are based on the most recent Mortgage that was taken out on this home.
Original Mortgage
$396,000
Outstanding Balance
$349,813
Interest Rate
3.7%
Mortgage Type
New Conventional
Estimated Equity
$313,732
Purchase Details
Closed on
Jul 12, 2017
Sold by
Marwuee Homes Inc
Bought by
Toner Eric and Toner Tiffany
Home Financials for this Owner
Home Financials are based on the most recent Mortgage that was taken out on this home.
Original Mortgage
$368,600
Interest Rate
3.94%
Mortgage Type
New Conventional
Purchase Details
Closed on
Oct 18, 2016
Sold by
Pettersen Properties Llc
Bought by
Hamblin Investments Inc and Gabby Development Llc
Create a Home Valuation Report for This Property
The Home Valuation Report is an in-depth analysis detailing your home's value as well as a comparison with similar homes in the area
Home Values in the Area
Average Home Value in this Area
Purchase History
| Date | Buyer | Sale Price | Title Company |
|---|---|---|---|
| Toner Eric R | -- | Metro National Title | |
| Toner Eric | -- | Security Title Of Davis Coun | |
| Hamblin Investments Inc | -- | None Available |
Source: Public Records
Mortgage History
| Date | Status | Borrower | Loan Amount |
|---|---|---|---|
| Open | Toner Eric R | $396,000 | |
| Closed | Toner Eric | $368,600 |
Source: Public Records
Tax History Compared to Growth
Tax History
| Year | Tax Paid | Tax Assessment Tax Assessment Total Assessment is a certain percentage of the fair market value that is determined by local assessors to be the total taxable value of land and additions on the property. | Land | Improvement |
|---|---|---|---|---|
| 2025 | $3,673 | $632,696 | $201,760 | $430,936 |
| 2024 | $3,520 | $342,099 | $110,866 | $231,233 |
| 2023 | $3,700 | $360,250 | $110,977 | $249,273 |
| 2022 | $3,714 | $371,251 | $108,246 | $263,005 |
| 2021 | $2,813 | $472,000 | $126,592 | $345,408 |
| 2020 | $2,772 | $427,000 | $107,290 | $319,710 |
| 2019 | $2,712 | $395,000 | $97,705 | $297,295 |
| 2018 | $2,811 | $393,000 | $97,705 | $295,295 |
| 2017 | $940 | $73,856 | $73,856 | $0 |
Source: Public Records
Map
Nearby Homes
- 4941 W 3575 S
- 3660 S 4700 W
- 3215 S 4950 W Unit 27
- 3678 S 4625 W Unit 225
- 3731 S 4975 W
- 3686 S 4625 W Unit 227
- 3690 S 4625 W Unit 228
- 4622 W 3725 S Unit 231
- 3243 S 4950 W Unit 25
- 3263 S 4950 W Unit 24
- 3225 S 4950 W Unit 26
- 3198 S 4950 W Unit 29
- 3192 S 4950 W Unit 28
- 3238 S 4950 W
- 4589 W 3725 S Unit 248
- 3233 S 4975 W Unit 14
- 3223 S 4975 W Unit 15
- 3257 S 4975 W Unit 12
- 3269 S 4975 W Unit 11
- 3549 S 4450 W
- 3517 S 4825 W
- 3481 S 4825 W
- 4838 W 3525 S Unit 17
- 3518 S 4875 W
- 3522 S 4875 W Unit 66
- 3504 S 4875 W Unit 64
- 3496 S 4825 W
- 4820 W 3525 S
- 3478 S 4825 W
- 4600 S 4875 W Unit 43
- 3473 S 4825 W
- 4874 W 3500 S
- 3470 S 4825 W
- 4841 W 3525 S Unit 24
- 4841 W 3525 S
- 4829 W 3525 S
- 3507 S 4875 W Unit 28
- 3495 S 4800 W
- 3515 S 4800 W
- 4821 W 3525 S Unit 22