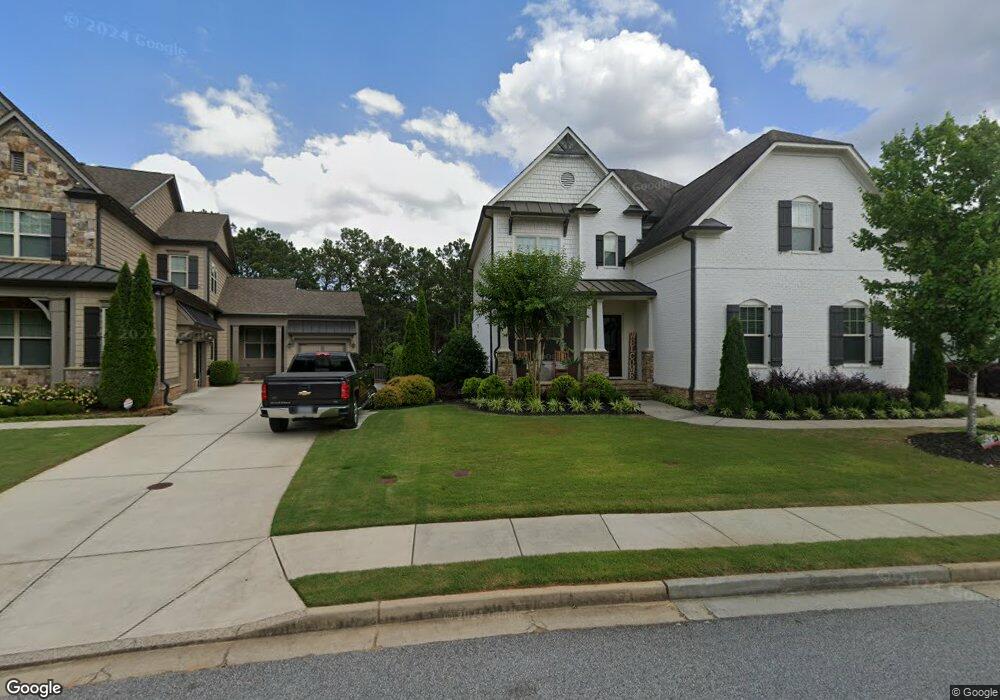
3492 Nettle Ln NE Unit 16 Roswell, GA 30075
East Cobb NeighborhoodEstimated Value: $1,060,000 - $1,482,000
5
Beds
5
Baths
3,900
Sq Ft
$334/Sq Ft
Est. Value
About This Home
This home is located at 3492 Nettle Ln NE Unit 16, Roswell, GA 30075 and is currently estimated at $1,300,662, approximately $333 per square foot. 3492 Nettle Ln NE Unit 16 is a home located in Cobb County with nearby schools including Shallowford Falls Elementary School, Simpson Middle School, and Lassiter High School.
Ownership History
Date
Name
Owned For
Owner Type
Purchase Details
Closed on
Jun 5, 2020
Sold by
Beyrent Wesley and Rees Roxanne
Bought by
Patel Shefaiji Sijdhir
Current Estimated Value
Purchase Details
Closed on
Jun 3, 2019
Sold by
Stein William A
Bought by
Beyrent Wesley P and Rees Roxanne
Home Financials for this Owner
Home Financials are based on the most recent Mortgage that was taken out on this home.
Original Mortgage
$701,100
Interest Rate
4.1%
Mortgage Type
New Conventional
Purchase Details
Closed on
Jun 3, 2016
Sold by
Crp Eah Mr Llc
Bought by
Stein William A and Stein Julia M
Home Financials for this Owner
Home Financials are based on the most recent Mortgage that was taken out on this home.
Original Mortgage
$595,000
Interest Rate
3.61%
Mortgage Type
New Conventional
Purchase Details
Closed on
Aug 11, 2015
Sold by
Crp Eah Mr Llc
Bought by
Josephson John Mark and Mcclain Amy
Create a Home Valuation Report for This Property
The Home Valuation Report is an in-depth analysis detailing your home's value as well as a comparison with similar homes in the area
Home Values in the Area
Average Home Value in this Area
Purchase History
| Date | Buyer | Sale Price | Title Company |
|---|---|---|---|
| Patel Shefaiji Sijdhir | $795,000 | None Available | |
| Beyrent Wesley P | $779,000 | -- | |
| Stein William A | $759,000 | -- | |
| Josephson John Mark | $754,514 | -- |
Source: Public Records
Mortgage History
| Date | Status | Borrower | Loan Amount |
|---|---|---|---|
| Previous Owner | Beyrent Wesley P | $701,100 | |
| Previous Owner | Stein William A | $595,000 |
Source: Public Records
Tax History Compared to Growth
Tax History
| Year | Tax Paid | Tax Assessment Tax Assessment Total Assessment is a certain percentage of the fair market value that is determined by local assessors to be the total taxable value of land and additions on the property. | Land | Improvement |
|---|---|---|---|---|
| 2025 | $13,032 | $492,268 | $120,000 | $372,268 |
| 2024 | $10,877 | $392,480 | $94,000 | $298,480 |
| 2023 | $10,335 | $392,480 | $94,000 | $298,480 |
| 2022 | $9,183 | $311,600 | $85,640 | $225,960 |
| 2021 | $9,183 | $311,600 | $85,640 | $225,960 |
| 2020 | $9,457 | $311,600 | $85,640 | $225,960 |
| 2019 | $9,391 | $341,896 | $94,000 | $247,896 |
| 2018 | $8,487 | $300,592 | $72,000 | $228,592 |
| 2017 | $8,096 | $300,592 | $72,000 | $228,592 |
| 2016 | $7,409 | $257,708 | $60,000 | $197,708 |
| 2015 | $1,591 | $54,000 | $54,000 | $0 |
Source: Public Records
Map
Nearby Homes
- 4146 Chimney Lake Dr NE
- 4220 Singing Post Ln NE
- 4149 Barberry Dr NE
- 3645 Lassiter Rd
- 4319 Summit Oaks Ln NE
- 3968 Rock Mill Dr
- 3810 Galloway Dr NE
- 4150 Chimney Heights NE
- 3402 Johnson Ferry Rd NE
- 3262 Carriage Way
- 3832 Wesley Chapel Rd
- 3760 Loch Highland Pkwy NE
- 3935 Chapel Heights Dr
- 4505 Bastion Dr
- 3856 Fenway Crossing
- 4509 Bastion Dr
- 3701 Shallowford Rd
- 3492 Nettle Ln NE
- 3488 Nettle Ln NE
- 3496 Nettle Ln NE
- 3484 Nettle Ln NE
- 0 Nettle Ln NE Unit 8686945
- 0 Nettle Ln NE Unit 7140048
- 0 Nettle Ln NE Unit 8964581
- 0 Nettle Ln NE Unit 2992761
- 0 Nettle Ln NE Unit 7221511
- 0 Nettle Ln NE Unit 7288041
- 0 Nettle Ln NE Unit 8048179
- 3500 Nettle Ln NE
- 3495 Nettle Ln NE Unit 1
- 3480 Nettle Ln NE
- 3489 Nettle Ln NE Unit 2
- 3504 Nettle Ln NE
- 3505 Nettle Ln NE
- 3474 Nettle Ln NE
- 3483 Nettle Ln NE Unit 3
- 3514 Nettle Ln NE Unit 721