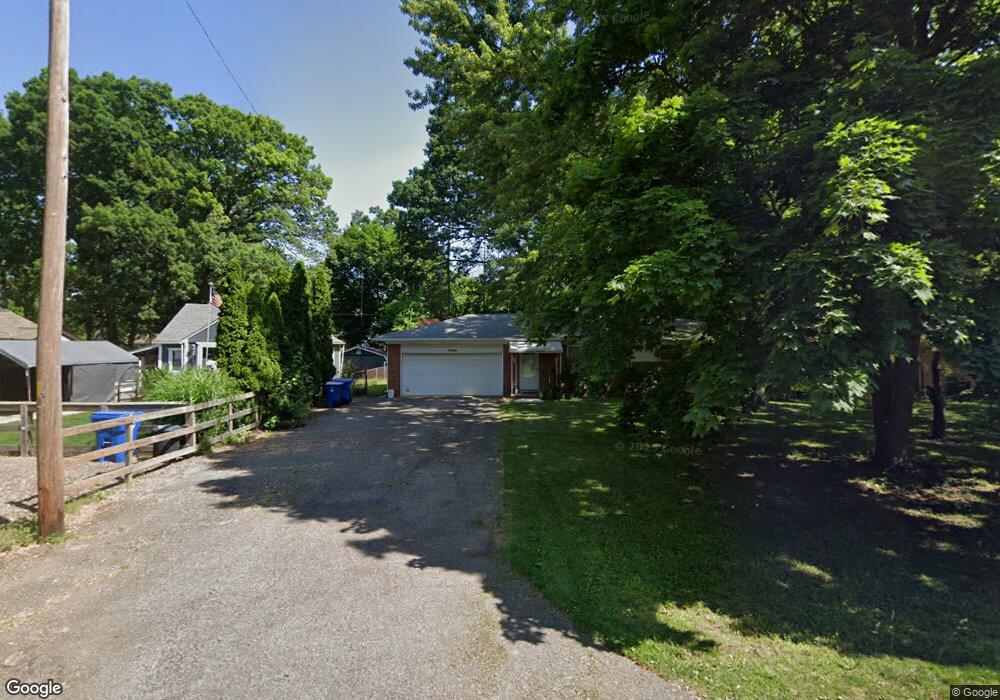
3492 Overton St Waterford, MI 48328
Waterford Township NeighborhoodEstimated Value: $246,685 - $276,000
2
Beds
2
Baths
1,320
Sq Ft
$200/Sq Ft
Est. Value
About This Home
This home is located at 3492 Overton St, Waterford, MI 48328 and is currently estimated at $263,921, approximately $199 per square foot. 3492 Overton St is a home located in Oakland County with nearby schools including Riverside Elementary School, Mason Middle School, and Waterford Mott High School.
Ownership History
Date
Name
Owned For
Owner Type
Purchase Details
Closed on
Aug 16, 2012
Sold by
Cartwright Susan M
Bought by
Davis Dale J
Current Estimated Value
Purchase Details
Closed on
Jul 27, 2011
Sold by
Vanderkolk Alan Anthony and Vanderkolk Cynthia
Bought by
Cartwright Susan M
Purchase Details
Closed on
Jul 8, 2004
Sold by
Almas Robert and Almas Margaret
Bought by
Vanderkolk Alan Anthony and Vanderkolk Cynthia
Purchase Details
Closed on
Nov 27, 2002
Sold by
Almas Margaret
Bought by
Almas Robert
Purchase Details
Closed on
Mar 25, 2002
Sold by
Tee Roger E
Bought by
Tee Margaret
Home Financials for this Owner
Home Financials are based on the most recent Mortgage that was taken out on this home.
Original Mortgage
$70,000
Interest Rate
7.24%
Purchase Details
Closed on
Dec 4, 1998
Sold by
Gorham Jack R
Bought by
Tee Roger E
Home Financials for this Owner
Home Financials are based on the most recent Mortgage that was taken out on this home.
Original Mortgage
$112,950
Interest Rate
6.83%
Create a Home Valuation Report for This Property
The Home Valuation Report is an in-depth analysis detailing your home's value as well as a comparison with similar homes in the area
Home Values in the Area
Average Home Value in this Area
Purchase History
| Date | Buyer | Sale Price | Title Company |
|---|---|---|---|
| Davis Dale J | $65,000 | Fidelity National Title | |
| Cartwright Susan M | $37,000 | Stewart Title | |
| Vanderkolk Alan Anthony | $170,000 | Metropolitan Title Company | |
| Almas Robert | -- | -- | |
| Tee Margaret | -- | -- | |
| Tee Roger E | $118,900 | -- |
Source: Public Records
Mortgage History
| Date | Status | Borrower | Loan Amount |
|---|---|---|---|
| Previous Owner | Tee Margaret | $70,000 | |
| Previous Owner | Tee Roger E | $112,950 |
Source: Public Records
Tax History Compared to Growth
Tax History
| Year | Tax Paid | Tax Assessment Tax Assessment Total Assessment is a certain percentage of the fair market value that is determined by local assessors to be the total taxable value of land and additions on the property. | Land | Improvement |
|---|---|---|---|---|
| 2024 | $1,272 | $96,280 | $0 | $0 |
| 2023 | $1,214 | $90,050 | $0 | $0 |
| 2022 | $1,976 | $84,560 | $0 | $0 |
| 2021 | $1,870 | $77,790 | $0 | $0 |
| 2020 | $1,111 | $76,710 | $0 | $0 |
| 2019 | $1,827 | $69,430 | $0 | $0 |
| 2018 | $1,813 | $69,280 | $0 | $0 |
| 2017 | $1,670 | $69,280 | $0 | $0 |
| 2016 | $1,666 | $63,970 | $0 | $0 |
| 2015 | -- | $55,950 | $0 | $0 |
| 2014 | -- | $48,560 | $0 | $0 |
| 2011 | -- | $48,180 | $0 | $0 |
Source: Public Records
Map
Nearby Homes
- 3633 Richmond St
- 1797 Manse Rd
- 1339 N Cass Lake Rd
- 2006 Watkins Lake Rd
- 2020 Watkins Lake Rd
- 3160 Lexington Rd
- 1249 Woodlow St
- 1120 Orchid St
- 4040 Lark Ave
- 1806 Colonial Village Way Unit 3
- 1842 Colonial Village Way Unit 4
- 3053 Mccormick Dr
- 995 N Cass Lake Rd Unit 229
- 995 N Cass Lake Rd Unit 237
- 995 N Cass Lake Rd Unit 221
- 3039 Mccormick Dr
- 1225 Eason
- 3871 Coventry Valley Dr
- 4073 Silver Birch Dr
- 4255 Lakewood Dr
- 3480 Overton St
- 3510 Overton St
- 3491 Richmond St
- 3479 Richmond St
- 3505 Richmond St Unit Bldg-Unit
- 3505 Richmond St
- 3530 Overton St
- 3456 Overton St
- 3467 Richmond St
- 3511 Overton St
- 3475 Overton St
- 3519 Richmond St
- 3519 Overton St
- 3455 Richmond St
- 3463 Overton St
- 3529 Richmond St
- 3527 Overton St
- 3540 Overton St
- 3444 Overton St
- 3486 Fort Dr