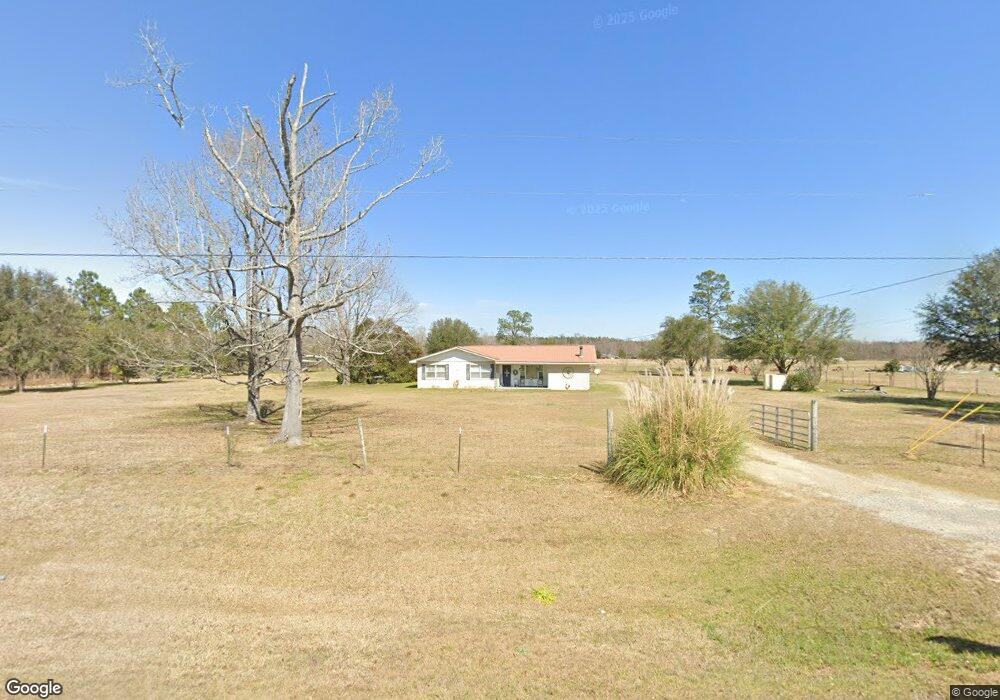
3493 Harrison Pringle Rd Harrison, GA 31035
Estimated Value: $95,467 - $213,000
Studio
2
Baths
1,434
Sq Ft
$95/Sq Ft
Est. Value
About This Home
This home is located at 3493 Harrison Pringle Rd, Harrison, GA 31035 and is currently estimated at $136,117, approximately $94 per square foot. 3493 Harrison Pringle Rd is a home located in Washington County with nearby schools including Ridge Road Primary School, Ridge Road Elementary School, and T.J. Elder Middle School.
Ownership History
Date
Name
Owned For
Owner Type
Purchase Details
Closed on
Apr 17, 2017
Sold by
Wilson Johnny Vann
Bought by
Veal Alton Burley
Current Estimated Value
Home Financials for this Owner
Home Financials are based on the most recent Mortgage that was taken out on this home.
Original Mortgage
$52,972
Interest Rate
4.3%
Mortgage Type
New Conventional
Purchase Details
Closed on
Mar 9, 2011
Sold by
Kellar Robert M
Bought by
Wilson Johnny Vann
Purchase Details
Closed on
Sep 14, 2005
Sold by
Wilson Johnny V
Bought by
Kellar Robert M
Purchase Details
Closed on
Jul 23, 2001
Sold by
Waller Johnie and Waller Geraldine
Bought by
Wilson Johnny V and Wilson Jeremy L
Purchase Details
Closed on
Aug 20, 1987
Sold by
Waller Phillip
Bought by
Waller Johnie and Waller Ethel G
Create a Home Valuation Report for This Property
The Home Valuation Report is an in-depth analysis detailing your home's value as well as a comparison with similar homes in the area
Purchase History
| Date | Buyer | Sale Price | Title Company |
|---|---|---|---|
| Veal Alton Burley | $52,000 | -- | |
| Wilson Johnny Vann | $50,000 | -- | |
| Kellar Robert M | $46,000 | -- | |
| Wilson Johnny V | -- | -- | |
| Waller Johnie | $25,000 | -- |
Source: Public Records
Mortgage History
| Date | Status | Borrower | Loan Amount |
|---|---|---|---|
| Closed | Veal Alton Burley | $52,972 |
Source: Public Records
Tax History
| Year | Tax Paid | Tax Assessment Tax Assessment Total Assessment is a certain percentage of the fair market value that is determined by local assessors to be the total taxable value of land and additions on the property. | Land | Improvement |
|---|---|---|---|---|
| 2025 | $1,045 | $33,472 | $3,840 | $29,632 |
| 2024 | $1,227 | $32,792 | $3,840 | $28,952 |
| 2023 | $770 | $21,272 | $1,200 | $20,072 |
| 2022 | $759 | $21,272 | $1,200 | $20,072 |
| 2021 | $777 | $21,272 | $1,200 | $20,072 |
| 2020 | $782 | $21,272 | $1,200 | $20,072 |
| 2019 | $780 | $21,272 | $1,200 | $20,072 |
| 2018 | $781 | $21,272 | $1,200 | $20,072 |
| 2017 | $506 | $19,324 | $1,216 | $18,108 |
| 2016 | $662 | $19,324 | $1,216 | $18,108 |
| 2015 | $551 | $806 | $1,216 | $18,108 |
| 2014 | $551 | $19,898 | $1,790 | $18,108 |
| 2013 | $551 | $19,898 | $1,790 | $18,108 |
Source: Public Records
Map
Nearby Homes
- 0 Bartow-Dublin Rd Unit 10559571
- 2010 Page Rd
- 3856 Ga Highway 231
- 1617 New Bethel Rd
- 4645 Pleasant Plains Rd
- 180 Miller St
- 230 Pringle Rd
- 9357 E Highway 242
- 0 Glover Rd
- 675 Jackson Rd
- 645 King Rd
- 1 Cross Cedar Rd
- 11 Hill St
- 8849 Sunhill Rd
- 6617 E College St
- 3700 Salter Rd
- 2645 E Elm St
- 304 W Trilby St
- 537 W Court St
- 554 W Court St
- 179 Waller Rd
- 179 Waller Rd
- 177 Pleasant Hill Rd
- 3721 Harrison Pringle Rd
- 3701 Harrison Pringle Rd
- 3204 Harrison Pringle Rd
- 3203 Harrison Pringle Rd
- 300 Pleasant Hill Rd
- 300 Pleasant Hill Church Rd
- 3610 Harrison Pringle Rd
- 123 Waller Rd
- 3880 Harrison Pringle Rd
- 3912 Harrison Pringle Rd
- 207 Waller Rd
- 3645 Harrison Pringle Rd
- 3766 Harrison Pringle Rd
- 3766 Harrison Pringle Rd
- 328 Waller Rd
- 2922 Harrison Pringle Rd
- 7636 News Bridge Rd
Your Personal Tour Guide
Ask me questions while you tour the home.