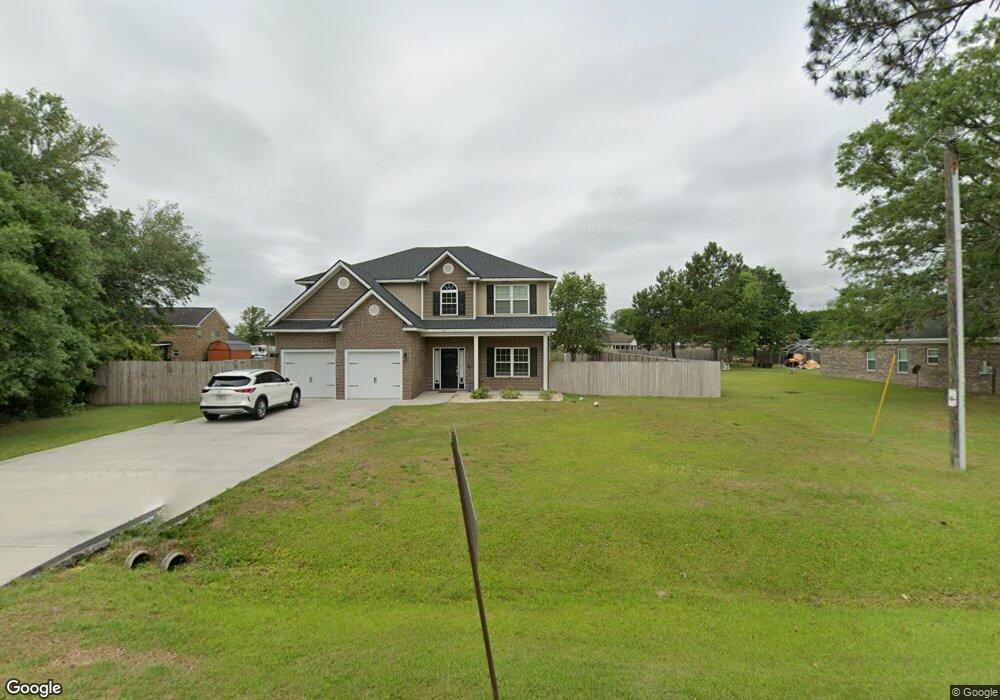
3493 John Wells Rd NE Hinesville, GA 31313
Estimated Value: $315,000 - $395,000
4
Beds
3
Baths
2,484
Sq Ft
$143/Sq Ft
Est. Value
About This Home
This home is located at 3493 John Wells Rd NE, Hinesville, GA 31313 and is currently estimated at $355,299, approximately $143 per square foot. 3493 John Wells Rd NE is a home with nearby schools including Smiley Elementary School, McClelland Elementary School, and Long County High School.
Ownership History
Date
Name
Owned For
Owner Type
Purchase Details
Closed on
Sep 2, 2025
Sold by
Figueroa Ashely P
Bought by
Figueroa Ashely P
Current Estimated Value
Purchase Details
Closed on
Dec 10, 2021
Sold by
Urban Brandon J
Bought by
Figueroa Mauro and Figueroa Ashely
Home Financials for this Owner
Home Financials are based on the most recent Mortgage that was taken out on this home.
Original Mortgage
$295,000
Interest Rate
2.98%
Mortgage Type
VA
Purchase Details
Closed on
Dec 11, 2018
Sold by
Jm Allen Construction Inc
Bought by
Urban Brandon J
Home Financials for this Owner
Home Financials are based on the most recent Mortgage that was taken out on this home.
Original Mortgage
$243,014
Interest Rate
4.9%
Purchase Details
Closed on
Nov 28, 2017
Sold by
Blue Ribbon Home Builders
Bought by
Jm Allen Homes Llc
Home Financials for this Owner
Home Financials are based on the most recent Mortgage that was taken out on this home.
Original Mortgage
$201,144
Interest Rate
3.94%
Mortgage Type
New Conventional
Purchase Details
Closed on
Apr 23, 2007
Sold by
Woolard Micheal and Deloach Richard C
Bought by
Blue Ribbon Home Builders Inc
Create a Home Valuation Report for This Property
The Home Valuation Report is an in-depth analysis detailing your home's value as well as a comparison with similar homes in the area
Home Values in the Area
Average Home Value in this Area
Purchase History
| Date | Buyer | Sale Price | Title Company |
|---|---|---|---|
| Figueroa Ashely P | -- | -- | |
| Figueroa Mauro | $295,000 | -- | |
| Urban Brandon J | $237,900 | -- | |
| Jm Allen Homes Llc | $22,000 | -- | |
| Blue Ribbon Home Builders Inc | $260,000 | -- |
Source: Public Records
Mortgage History
| Date | Status | Borrower | Loan Amount |
|---|---|---|---|
| Previous Owner | Figueroa Mauro | $295,000 | |
| Previous Owner | Urban Brandon J | $243,014 | |
| Previous Owner | Jm Allen Homes Llc | $201,144 |
Source: Public Records
Tax History Compared to Growth
Tax History
| Year | Tax Paid | Tax Assessment Tax Assessment Total Assessment is a certain percentage of the fair market value that is determined by local assessors to be the total taxable value of land and additions on the property. | Land | Improvement |
|---|---|---|---|---|
| 2024 | $402 | $93,208 | $8,800 | $84,408 |
| 2023 | $252 | $93,208 | $8,800 | $84,408 |
| 2022 | $3,116 | $93,208 | $8,800 | $84,408 |
| 2021 | $2,631 | $78,378 | $8,800 | $69,578 |
| 2020 | $2,646 | $78,378 | $8,800 | $69,578 |
| 2019 | $2,646 | $78,378 | $8,800 | $69,578 |
| 2018 | $229 | $7,200 | $7,200 | $0 |
| 2017 | $229 | $7,200 | $7,200 | $0 |
| 2016 | $222 | $7,200 | $7,200 | $0 |
| 2015 | -- | $7,200 | $7,200 | $0 |
| 2014 | -- | $7,200 | $7,200 | $0 |
| 2013 | -- | $7,200 | $7,200 | $0 |
Source: Public Records
Map
Nearby Homes
- 3453 John Wells Rd NE
- 124 Murrell Rd
- 3010 John Wells Rd
- 3453 John Wells Rd
- 452 Hardee Rd
- 602 Hardee Rd NE
- 268 Kalynne Way NE
- 104 Kalynne Way NE
- 130 Kalynne Way NE
- 271 Silver Hill Rd
- 537 Long Rd
- 22 Tower Rd
- 24 Tower Rd
- 710 S T Morris Rd NE
- 00 Worth Groover Rd
- 95 Cattle Fence Dr NE
- 173 Akins Ranch Rd NE
- 166 Cattle Fence Dr NE
- 86 White Oak Dr NE
- 3561 John Wells Rd NE
- 178 Evans Ln NE
- 3539 John Wells Rd
- 159 Evans Ln NE
- 12838 Ga Highway 196
- 146 Evans Ln NE
- 3550 John Wells Rd
- 151 Evans Ln NE
- 5115 John Wells Rd
- 12814 Ga Highway 196
- 3493 John Wells Rd
- 3500 John Wells Rd
- 126 Evans Ln NE
- 119 Evans Ln NE
- 3460 John Wells Rd
- 96 Evans Ln NE
- 189 Conner Dr
- 105 Evans Ln NE
- 3561 John Wells Rd
- 3539 John Wells Rd