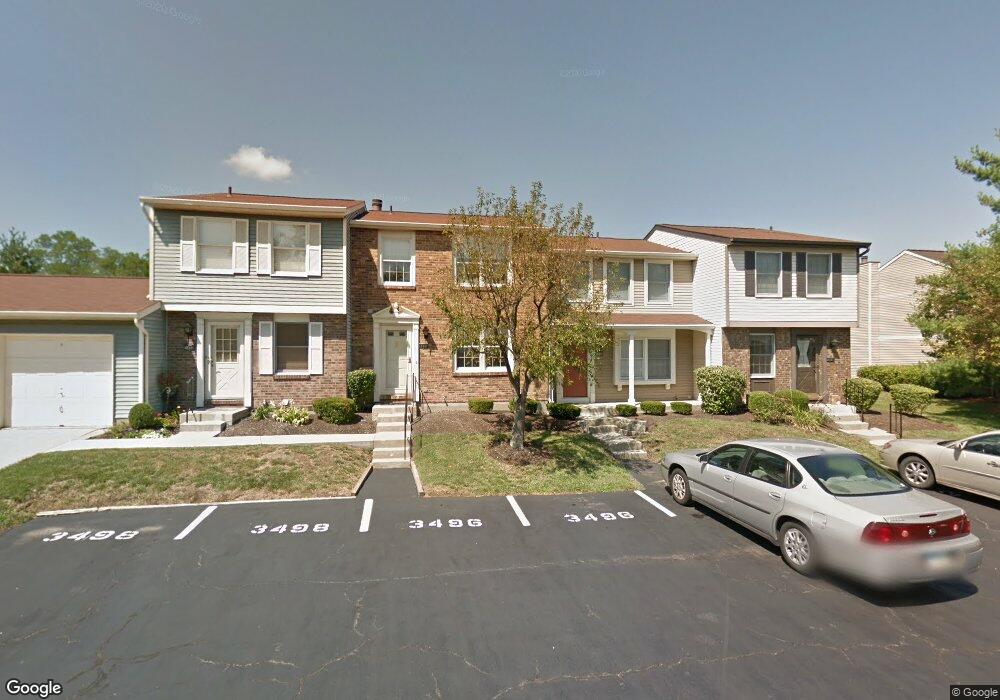
3494 Statewood Dr Unit 1C Cincinnati, OH 45251
Estimated Value: $128,860 - $169,000
2
Beds
2
Baths
1,288
Sq Ft
$112/Sq Ft
Est. Value
About This Home
This home is located at 3494 Statewood Dr Unit 1C, Cincinnati, OH 45251 and is currently estimated at $143,965, approximately $111 per square foot. 3494 Statewood Dr Unit 1C is a home located in Hamilton County with nearby schools including Taylor Elementary School, Pleasant Run Elementary School, and Colerain Middle School.
Ownership History
Date
Name
Owned For
Owner Type
Purchase Details
Closed on
Mar 26, 2024
Sold by
Wells Makenzie L
Bought by
Leveline Jeff and Leveline Linda
Current Estimated Value
Purchase Details
Closed on
Oct 20, 2009
Sold by
Federal Home Loan Mortgage Corporation
Bought by
Wells Makenzie L
Home Financials for this Owner
Home Financials are based on the most recent Mortgage that was taken out on this home.
Original Mortgage
$47,130
Interest Rate
5.12%
Mortgage Type
FHA
Purchase Details
Closed on
Jul 20, 2009
Sold by
Key Lenea N
Bought by
Federal Home Loan Mortgage Corporation
Purchase Details
Closed on
Aug 17, 2006
Sold by
Isay Terri A and Isay Bryan
Bought by
Key Lenea N
Home Financials for this Owner
Home Financials are based on the most recent Mortgage that was taken out on this home.
Original Mortgage
$78,320
Interest Rate
6.88%
Mortgage Type
Unknown
Create a Home Valuation Report for This Property
The Home Valuation Report is an in-depth analysis detailing your home's value as well as a comparison with similar homes in the area
Home Values in the Area
Average Home Value in this Area
Purchase History
| Date | Buyer | Sale Price | Title Company |
|---|---|---|---|
| Leveline Jeff | $98,000 | None Listed On Document | |
| Leveline Jeff | $98,000 | None Listed On Document | |
| Wells Makenzie L | $48,000 | Attorney | |
| Federal Home Loan Mortgage Corporation | $54,000 | None Available | |
| Key Lenea N | $97,900 | None Available |
Source: Public Records
Mortgage History
| Date | Status | Borrower | Loan Amount |
|---|---|---|---|
| Previous Owner | Wells Makenzie L | $47,130 | |
| Previous Owner | Key Lenea N | $78,320 |
Source: Public Records
Tax History Compared to Growth
Tax History
| Year | Tax Paid | Tax Assessment Tax Assessment Total Assessment is a certain percentage of the fair market value that is determined by local assessors to be the total taxable value of land and additions on the property. | Land | Improvement |
|---|---|---|---|---|
| 2024 | $2,255 | $42,245 | $5,250 | $36,995 |
| 2023 | $2,268 | $42,245 | $5,250 | $36,995 |
| 2022 | $1,839 | $27,909 | $2,436 | $25,473 |
| 2021 | $1,823 | $27,909 | $2,436 | $25,473 |
| 2020 | $1,842 | $27,909 | $2,436 | $25,473 |
| 2019 | $1,370 | $19,352 | $2,100 | $17,252 |
| 2018 | $1,229 | $19,352 | $2,100 | $17,252 |
| 2017 | $1,164 | $19,352 | $2,100 | $17,252 |
| 2016 | $720 | $11,760 | $3,430 | $8,330 |
| 2015 | $727 | $11,760 | $3,430 | $8,330 |
| 2014 | $728 | $11,760 | $3,430 | $8,330 |
| 2013 | $987 | $16,800 | $4,900 | $11,900 |
Source: Public Records
Map
Nearby Homes
- 9568 Woodstate Dr
- 9558 Woodstate Dr Unit 13E
- 3351 Deshler Dr
- 9446 Haddington Ct
- 3463 Amberway Ct
- 3275 Deshler Dr
- 3276 Deshler Dr
- 3246 Ainsworth Dr
- 3151 Birchway Dr Unit 3151
- 3545 Alamosa Dr
- 9717 Loralinda Dr
- 3258 Lillwood Ln
- 9784 Loralinda Dr
- 9126 Round Top Rd
- 9125 Round Top Rd
- 3719 Sagebrush Ln
- 3119 Deshler Dr
- 9828 Loralinda Dr
- 9302 Loralinda Dr
- 9303 Wilcox Dr
- 3496 Statewood Dr
- 3492 Statewood Dr
- 3496 Statewood Dr
- 3496 Statewood Dr Unit B
- 3492 Statewood Dr Unit 1D
- 3496 Statewood Dr Unit 1B
- 3498 Statewood Dr Unit 1A
- 3498 Statewood Dr Unit 1A
- 3498 Statewood Dr
- 3488 Statewood Dr
- 3493 Statewood Dr
- 3490 Statewood Dr
- 3486 Statewood Dr Unit 2D
- 3482 Statewood Dr
- 3490 Statewood Dr Unit 2F
- 3482 Statewood Dr Unit 2B
- 3484 Statewood Dr
- 3497 Statewood Dr
- 3497 Statewood Dr Unit 3A
- 3491 Statewood Dr Unit 3D