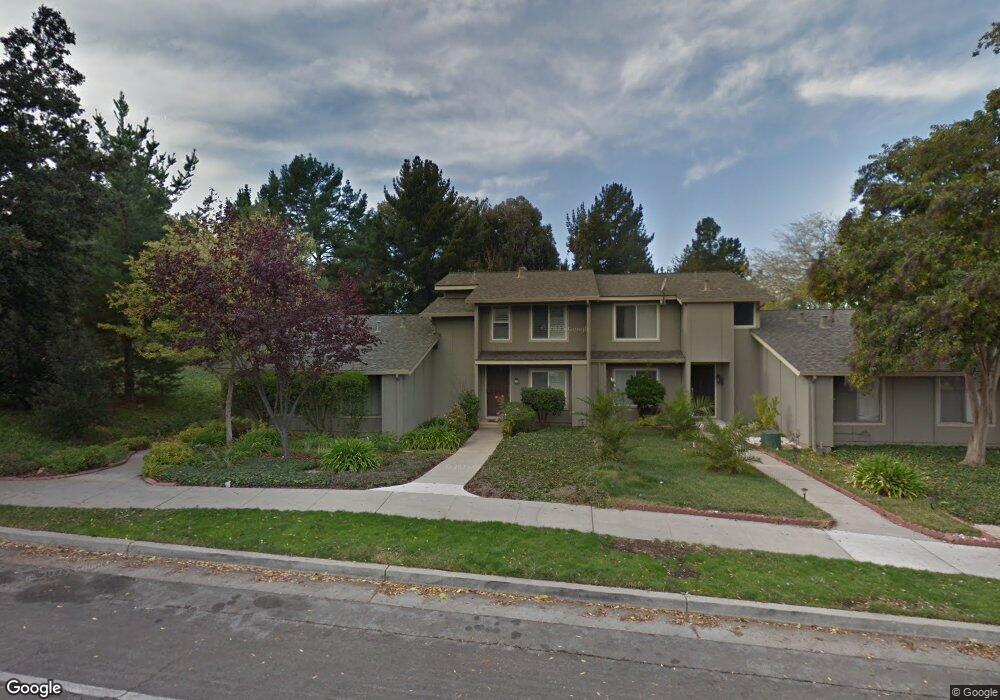
3495 Bathgate Ln San Jose, CA 95121
Brigadoon NeighborhoodEstimated Value: $698,672 - $818,000
4
Beds
2
Baths
1,320
Sq Ft
$571/Sq Ft
Est. Value
About This Home
This home is located at 3495 Bathgate Ln, San Jose, CA 95121 and is currently estimated at $753,168, approximately $570 per square foot. 3495 Bathgate Ln is a home located in Santa Clara County with nearby schools including John J. Montgomery Elementary School, Chaboya Middle School, and Silver Creek High School.
Ownership History
Date
Name
Owned For
Owner Type
Purchase Details
Closed on
Oct 10, 2006
Sold by
Vu Loi Ngoc and Tran Thanh Thuy Thi
Bought by
Loi Ngoc Vu & Thanh Thuy Thi Tran Living
Current Estimated Value
Purchase Details
Closed on
Nov 13, 2003
Sold by
Tran Thanh Thuy Thi
Bought by
Vu Loi Ngoc and Tran Thanh Thuy Thi
Purchase Details
Closed on
Feb 20, 1998
Sold by
Vu Loi Ngoc
Bought by
Tran Thanh Thuy Thi
Home Financials for this Owner
Home Financials are based on the most recent Mortgage that was taken out on this home.
Original Mortgage
$75,000
Interest Rate
6.46%
Mortgage Type
Purchase Money Mortgage
Purchase Details
Closed on
Jul 14, 1995
Sold by
Mannino Vito and Mannino Rosalia
Bought by
Tran Thanh Thuy
Home Financials for this Owner
Home Financials are based on the most recent Mortgage that was taken out on this home.
Original Mortgage
$98,400
Interest Rate
7.74%
Mortgage Type
Purchase Money Mortgage
Create a Home Valuation Report for This Property
The Home Valuation Report is an in-depth analysis detailing your home's value as well as a comparison with similar homes in the area
Home Values in the Area
Average Home Value in this Area
Purchase History
| Date | Buyer | Sale Price | Title Company |
|---|---|---|---|
| Loi Ngoc Vu & Thanh Thuy Thi Tran Living | -- | None Available | |
| Vu Loi Ngoc | -- | -- | |
| Tran Thanh Thuy Thi | -- | Fidelity National Title Co | |
| Tran Thanh Thuy | $123,000 | Chicago Title |
Source: Public Records
Mortgage History
| Date | Status | Borrower | Loan Amount |
|---|---|---|---|
| Closed | Tran Thanh Thuy Thi | $75,000 | |
| Closed | Tran Thanh Thuy | $98,400 |
Source: Public Records
Tax History
| Year | Tax Paid | Tax Assessment Tax Assessment Total Assessment is a certain percentage of the fair market value that is determined by local assessors to be the total taxable value of land and additions on the property. | Land | Improvement |
|---|---|---|---|---|
| 2025 | $4,152 | $204,305 | $81,717 | $122,588 |
| 2024 | $4,152 | $200,300 | $80,115 | $120,185 |
| 2023 | $4,039 | $196,374 | $78,545 | $117,829 |
| 2022 | $4,012 | $192,524 | $77,005 | $115,519 |
| 2021 | $3,893 | $188,750 | $75,496 | $113,254 |
| 2020 | $3,709 | $186,815 | $74,722 | $112,093 |
| 2019 | $3,599 | $183,153 | $73,257 | $109,896 |
| 2018 | $3,528 | $179,563 | $71,821 | $107,742 |
| 2017 | $3,467 | $176,043 | $70,413 | $105,630 |
| 2016 | $3,306 | $172,592 | $69,033 | $103,559 |
| 2015 | $3,256 | $170,001 | $67,997 | $102,004 |
| 2014 | $2,771 | $166,672 | $66,666 | $100,006 |
Source: Public Records
Map
Nearby Homes
- 2114 Bennighof Ct
- 1992 Uphall Ct
- 3550 Kettmann Rd
- 3338 Woodside Ln
- 2715 Millbrae Way
- 3261 Everdale Dr
- 2855 Weyers Ct
- 2854 Lowell Ct
- 1497 Meadow Glen Way
- 1498 Sleepy Meadow Ct
- 4063 Cadwallader Ave
- 3804 Yerba Buena Ave
- 3556 Squirecreek Cir
- 3032 Oakbridge Dr Unit 3032
- 1520 E Capitol Expy Unit 54
- 3135 Oakbridge Dr Unit 3135
- 1452 Cottlestone Ct
- 3241 Shadow Park Place
- 3016 Shadow Springs Place Unit 113
- 1414 Cottlestone Ct
- 3491 Bathgate Ln
- 3499 Bathgate Ln
- 3487 Bathgate Ln
- 3483 Bathgate Ln
- 3479 Bathgate Ln
- 3475 Bathgate Ln
- 3474 Bathgate Ln
- 3470 Bathgate Ln
- 3467 Bathgate Ln
- 3466 Bathgate Ln
- 2356 Blanding Ave
- 3463 Bathgate Ln
- 3462 Bathgate Ln
- 2357 Nieman Ct
- 3458 Bathgate Ln
- 3459 Bathgate Ln
- 3454 Bathgate Ln
- 3455 Bathgate Ln
- 2368 Blanding Ave
- 2363 Nieman Ct
Your Personal Tour Guide
Ask me questions while you tour the home.