N
Seller's Agent in 2025
Nancy Anthony
Global Realty Northwest-Oregon
(541) 881-9399
101 Total Sales
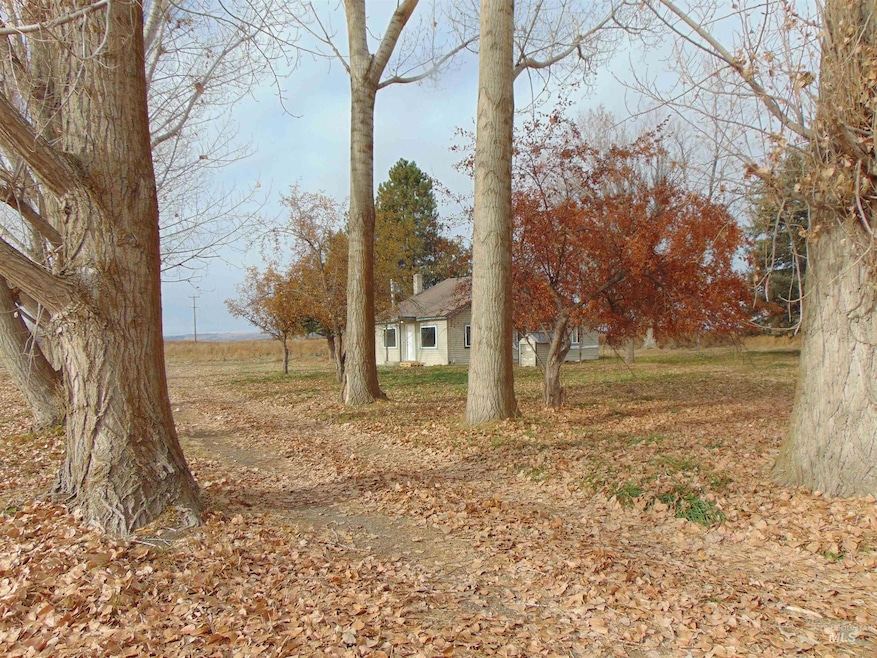


Newly renovated home on this unique piece to property. Sits on 6.25 acres with a 4 acre water right in the Warmsprings district. Farmable, flat ground usable for about anything. Ready for your Family and animals alike. House has a metal roof and vinyl siding for low maintence. There is new paint and laminate flooring in the house. Open kitchen w/ island. New appliances. New bathroom. Mud room. Mature trees. Room to roam but close to town. Call today to view!!
Last Agent to Sell the Property
Global Realty Northwest-Oregon Brokerage Phone: 541-889-2040 Listed on: 11/15/2025
| Date | Type | Sale Price | Title Company |
|---|---|---|---|
| Warranty Deed | $303,000 | Pioneer Title | |
| Deed | $142,886 | None Listed On Document | |
| Warranty Deed | $120,000 | Malheur County Title Company | |
| Personal Reps Deed | $75,000 | None Available |
| Date | Status | Loan Amount | Loan Type |
|---|---|---|---|
| Open | $293,910 | New Conventional | |
| Previous Owner | $96,000 | New Conventional | |
| Previous Owner | $61,873 | Purchase Money Mortgage |
| Date | Event | Price | List to Sale | Price per Sq Ft |
|---|---|---|---|---|
| 12/24/2025 12/24/25 | Sold | -- | -- | -- |
| 11/24/2025 11/24/25 | Pending | -- | -- | -- |
| 11/15/2025 11/15/25 | For Sale | $295,000 | -- | $234 / Sq Ft |
| Year | Tax Paid | Tax Assessment Tax Assessment Total Assessment is a certain percentage of the fair market value that is determined by local assessors to be the total taxable value of land and additions on the property. | Land | Improvement |
|---|---|---|---|---|
| 2025 | $562 | $52,996 | $15,170 | $37,826 |
| 2024 | $552 | $51,590 | $14,865 | $36,725 |
| 2023 | $535 | $50,225 | $14,569 | $35,656 |
| 2022 | $523 | $48,899 | $14,281 | $34,618 |
| 2021 | $536 | $47,611 | $14,001 | $33,610 |
| 2020 | $502 | $46,363 | $13,731 | $32,632 |
| 2019 | $492 | $45,150 | $13,468 | $31,682 |
| 2018 | $483 | $43,972 | $13,212 | $30,760 |
| 2017 | $464 | $42,828 | $12,963 | $29,865 |
| 2016 | $435 | $41,719 | $12,723 | $28,996 |
| 2015 | $438 | $40,641 | $12,489 | $28,152 |
| 2014 | $428 | $39,595 | $12,262 | $27,333 |
N
Seller's Agent in 2025
Nancy Anthony
Global Realty Northwest-Oregon
(541) 881-9399
101 Total Sales

Buyer's Agent in 2025
Rebecca Knott
Tailored Real Estate, LLC
(208) 941-2160
192 Total Sales
Source: Intermountain MLS
MLS Number: 98967718
APN: 14484
Disclaimer: Certain information contained herein is derived from information provided by parties other than Homes.com. All information provided is deemed reliable, but is not guaranteed to be accurate and should be independently verified.
![]() IDX information is provided exclusively for consumers’ personal, non-commercial use, that it may not be used for any purpose other than to identify prospective properties consumers may be interested in purchasing. IMLS does not assume any liability for missing or inaccurate data.
IDX information is provided exclusively for consumers’ personal, non-commercial use, that it may not be used for any purpose other than to identify prospective properties consumers may be interested in purchasing. IMLS does not assume any liability for missing or inaccurate data.
Information provided by IMLS is deemed reliable but not guaranteed.
Ask me questions while you tour the home.