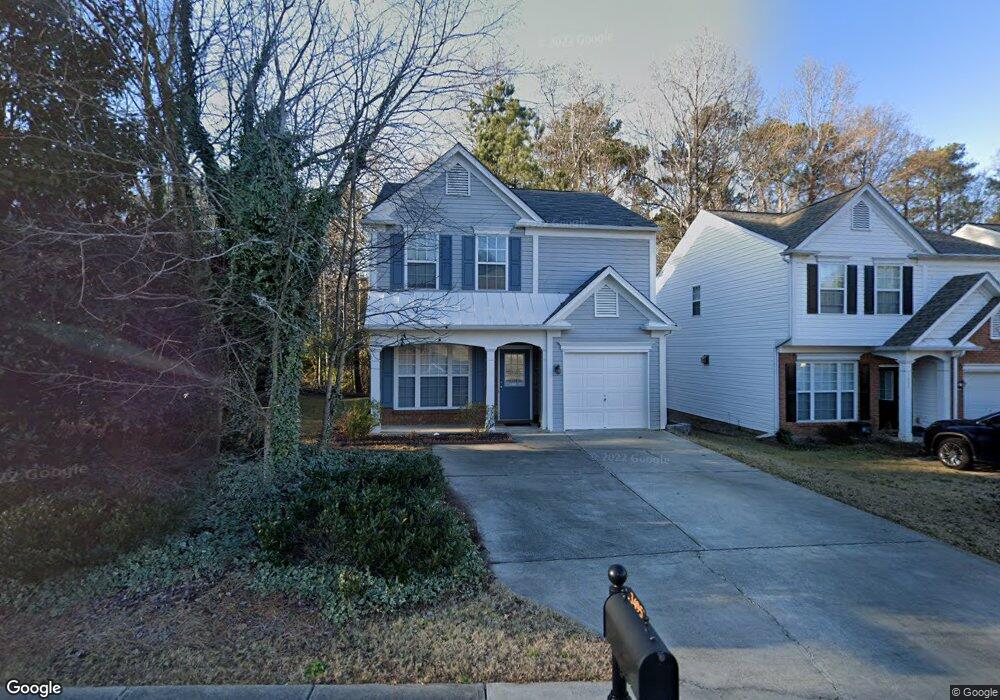
3495 Oxwell Dr Unit 1 Duluth, GA 30096
Estimated Value: $365,000 - $382,284
3
Beds
3
Baths
1,447
Sq Ft
$259/Sq Ft
Est. Value
About This Home
This home is located at 3495 Oxwell Dr Unit 1, Duluth, GA 30096 and is currently estimated at $374,821, approximately $259 per square foot. 3495 Oxwell Dr Unit 1 is a home located in Gwinnett County with nearby schools including B.B. Harris Elementary School, Duluth Middle School, and Duluth High School.
Ownership History
Date
Name
Owned For
Owner Type
Purchase Details
Closed on
Nov 15, 2006
Sold by
Yan Manqun
Bought by
Ly Ken S
Current Estimated Value
Home Financials for this Owner
Home Financials are based on the most recent Mortgage that was taken out on this home.
Original Mortgage
$122,500
Outstanding Balance
$70,309
Interest Rate
5.87%
Mortgage Type
New Conventional
Estimated Equity
$304,512
Purchase Details
Closed on
Jun 3, 2005
Sold by
Suggs Glenn W
Bought by
Yan Manqun
Home Financials for this Owner
Home Financials are based on the most recent Mortgage that was taken out on this home.
Original Mortgage
$234,100
Interest Rate
5.69%
Mortgage Type
New Conventional
Purchase Details
Closed on
Mar 6, 2000
Sold by
Pulte Home Corp
Bought by
Suggs Glenn W
Home Financials for this Owner
Home Financials are based on the most recent Mortgage that was taken out on this home.
Original Mortgage
$133,722
Interest Rate
8.3%
Mortgage Type
VA
Create a Home Valuation Report for This Property
The Home Valuation Report is an in-depth analysis detailing your home's value as well as a comparison with similar homes in the area
Home Values in the Area
Average Home Value in this Area
Purchase History
| Date | Buyer | Sale Price | Title Company |
|---|---|---|---|
| Ly Ken S | $167,500 | -- | |
| Yan Manqun | $149,000 | -- | |
| Suggs Glenn W | $131,200 | -- |
Source: Public Records
Mortgage History
| Date | Status | Borrower | Loan Amount |
|---|---|---|---|
| Open | Ly Ken S | $122,500 | |
| Previous Owner | Yan Manqun | $234,100 | |
| Previous Owner | Suggs Glenn W | $133,722 |
Source: Public Records
Tax History Compared to Growth
Tax History
| Year | Tax Paid | Tax Assessment Tax Assessment Total Assessment is a certain percentage of the fair market value that is determined by local assessors to be the total taxable value of land and additions on the property. | Land | Improvement |
|---|---|---|---|---|
| 2025 | $3,842 | $146,200 | $29,920 | $116,280 |
| 2024 | $3,838 | $139,600 | $30,000 | $109,600 |
| 2023 | $3,838 | $143,840 | $30,000 | $113,840 |
| 2022 | $3,359 | $118,280 | $24,000 | $94,280 |
| 2021 | $2,883 | $93,120 | $18,000 | $75,120 |
| 2020 | $2,903 | $93,120 | $18,000 | $75,120 |
| 2019 | $2,729 | $88,280 | $18,000 | $70,280 |
| 2018 | $2,505 | $77,920 | $14,800 | $63,120 |
| 2016 | $2,285 | $66,760 | $14,000 | $52,760 |
| 2015 | $2,087 | $56,840 | $14,000 | $42,840 |
| 2014 | -- | $54,360 | $12,800 | $41,560 |
Source: Public Records
Map
Nearby Homes
- 2995 Oxwell Dr Unit 1
- 3412 Davenport Park Ln
- 3190 Oxwell Dr
- 3215 Oxwell Dr Unit 1B
- 3053 Hartright Bend Ct
- 3289 Davenport Park Ln
- 2644 Davenport Rd
- 3576 Randy Place
- 2702 Davenport Rd
- 3593 Gainesway Ct
- 3592 Gainesway Trace
- 3614 Gainesway Trace
- 2830 Meadow Lark Trail
- 2239 Dandridge Dr
- 2829 Cardinal Trace
- 2377 Fawn Hollow Ct
- 3518 Tracey Dr
- 2888 Cardinal Trace
- 2347 Fawn Hollow Ct Unit 1
- 2590 Village Place Dr
- 3485 Oxwell Dr
- 3475 Oxwell Dr
- 3475 Oxwell Dr Unit 3475
- 2955 Oxwell Dr
- 2965 Oxwell Dr Unit 1
- 2933 Regent Walk Dr
- 2950 Oxwell Dr Unit 1
- 2975 Oxwell Dr
- 2923 Regent Walk Dr
- 2924 Regent Walk Dr Unit 11A
- 2970 Oxwell Dr
- 3445 Oxwell Dr
- 3445 Oxwell Dr Unit 3445
- 3450 Oxwell Dr
- 2914 Regent Walk Dr
- 2985 Oxwell Dr
- 2985 Oxwell Dr NW
- 2444 Regent Walk Dr
- 2990 Qxwell Dr
- 2990 Oxwell Dr