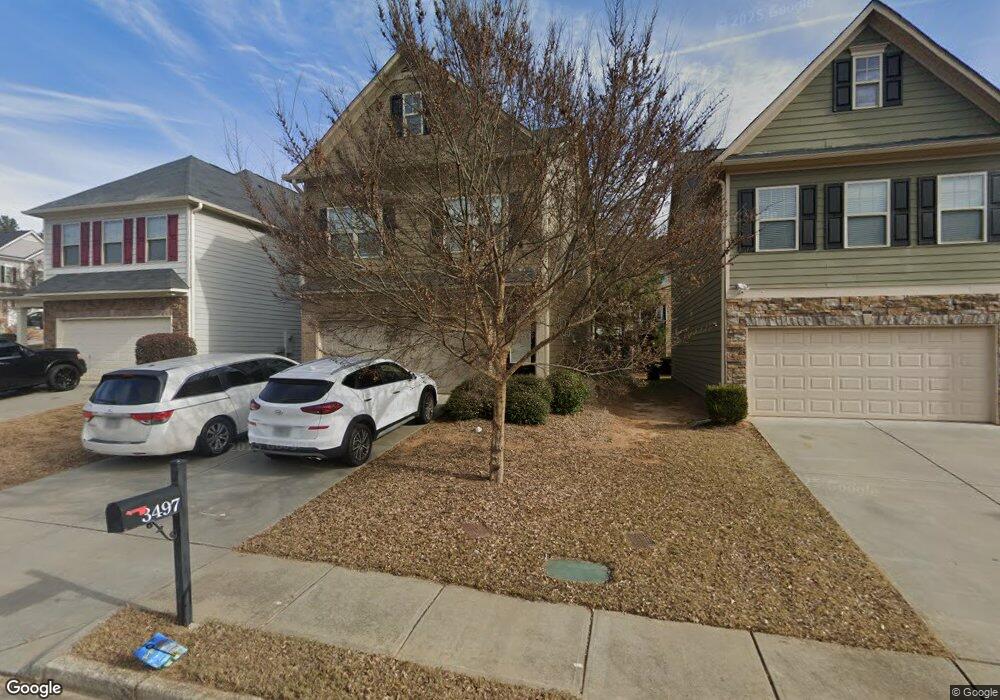
3497 Greyhawk Crossing Unit 35 Buford, GA 30519
Estimated Value: $430,000 - $444,000
4
Beds
4
Baths
2,326
Sq Ft
$187/Sq Ft
Est. Value
About This Home
This home is located at 3497 Greyhawk Crossing Unit 35, Buford, GA 30519 and is currently estimated at $435,028, approximately $187 per square foot. 3497 Greyhawk Crossing Unit 35 is a home located in Gwinnett County with nearby schools including Patrick Elementary School, Glenn C. Jones Middle School, and Old Suwanee Christian School.
Ownership History
Date
Name
Owned For
Owner Type
Purchase Details
Closed on
Feb 20, 2020
Sold by
Kim Chungman
Bought by
Zhang Xin and Wu Li
Current Estimated Value
Home Financials for this Owner
Home Financials are based on the most recent Mortgage that was taken out on this home.
Original Mortgage
$168,000
Outstanding Balance
$114,888
Interest Rate
3.6%
Mortgage Type
New Conventional
Estimated Equity
$320,140
Purchase Details
Closed on
Jun 12, 2015
Sold by
Jakes Thomas
Bought by
Kim Chungman
Home Financials for this Owner
Home Financials are based on the most recent Mortgage that was taken out on this home.
Original Mortgage
$189,000
Interest Rate
3.92%
Mortgage Type
New Conventional
Purchase Details
Closed on
Jun 27, 2014
Sold by
Sdc Gwinnett Llc
Bought by
Jakes Thomas
Purchase Details
Closed on
Mar 6, 2014
Sold by
Bfp Funding Llc
Bought by
Sdc Gwinnett Llc
Purchase Details
Closed on
Jan 13, 2014
Sold by
Highland Falls Llc
Bought by
Bfp Funding Llc
Create a Home Valuation Report for This Property
The Home Valuation Report is an in-depth analysis detailing your home's value as well as a comparison with similar homes in the area
Home Values in the Area
Average Home Value in this Area
Purchase History
| Date | Buyer | Sale Price | Title Company |
|---|---|---|---|
| Zhang Xin | $268,000 | -- | |
| Kim Chungman | $210,000 | -- | |
| Jakes Thomas | $210,330 | -- | |
| Sdc Gwinnett Llc | -- | -- | |
| Bfp Funding Llc | -- | -- | |
| Highland Falls Llc | $960,000 | -- |
Source: Public Records
Mortgage History
| Date | Status | Borrower | Loan Amount |
|---|---|---|---|
| Open | Zhang Xin | $168,000 | |
| Previous Owner | Kim Chungman | $189,000 |
Source: Public Records
Tax History Compared to Growth
Tax History
| Year | Tax Paid | Tax Assessment Tax Assessment Total Assessment is a certain percentage of the fair market value that is determined by local assessors to be the total taxable value of land and additions on the property. | Land | Improvement |
|---|---|---|---|---|
| 2025 | $6,694 | $181,640 | $32,800 | $148,840 |
| 2024 | $6,594 | $176,760 | $34,800 | $141,960 |
| 2023 | $6,594 | $179,840 | $34,800 | $145,040 |
| 2022 | $5,945 | $159,320 | $26,800 | $132,520 |
| 2021 | $4,142 | $106,760 | $20,320 | $86,440 |
| 2020 | $4,166 | $106,760 | $20,320 | $86,440 |
| 2019 | $4,013 | $106,760 | $20,320 | $86,440 |
| 2018 | $3,597 | $94,760 | $18,000 | $76,760 |
| 2016 | $3,236 | $84,000 | $15,600 | $68,400 |
| 2015 | $3,078 | $79,720 | $15,600 | $64,120 |
| 2014 | $172 | $4,240 | $4,240 | $0 |
Source: Public Records
Map
Nearby Homes
- 3367 Greyhawk Crossing
- 2689 Woodward Down Trail NE
- 1785 Plunketts Rd
- 2939 Woodward Down Trail
- 1466 Clarecastle Ln
- 1510 Oklahoma Dr
- 1320 Newbridge Cir
- 3570 Knoll Crest Trail
- 3735 Fir Dr
- 3790 Salvia Dr
- 3641 Deaton Trail
- 2852 Habibi Ct
- 2850 Habibi Ct
- 1781 Plunketts Rd
- 3962 Adler Cir Unit 7
- 4152 Adler Cir Unit 42
- 3962 Adler Cir
- 4152 Adler Cir
- 3497 Greyhawk Crossing
- 3487 Greyhawk Crossing Unit 34C
- 3487 Greyhawk Crossing
- 3507 Greyhawk Crossing
- 3477 Greyhawk Crossing
- 3468 Woodward Down Trail NE
- 3478 Woodward Down Trail Unit 1C
- 3478 Woodward Down Trail
- 3467 Greyhawk Crossing
- 3458 Woodward Down Trail
- 3448 Woodward Down Trail NE
- 2708 Woodward Down Trail
- 3486 Greyhawk Crossing
- 3438 Woodward Down Trail
- 3457 Greyhawk Crossing
- 3476 Greyhawk Crossing
- 0 Woodward Down Trail Unit 8688182
- 0 Woodward Down Trail Unit 8610977
- 0 Woodward Down Trail Unit 8316288
- 0 Woodward Down Trail Unit 8022158