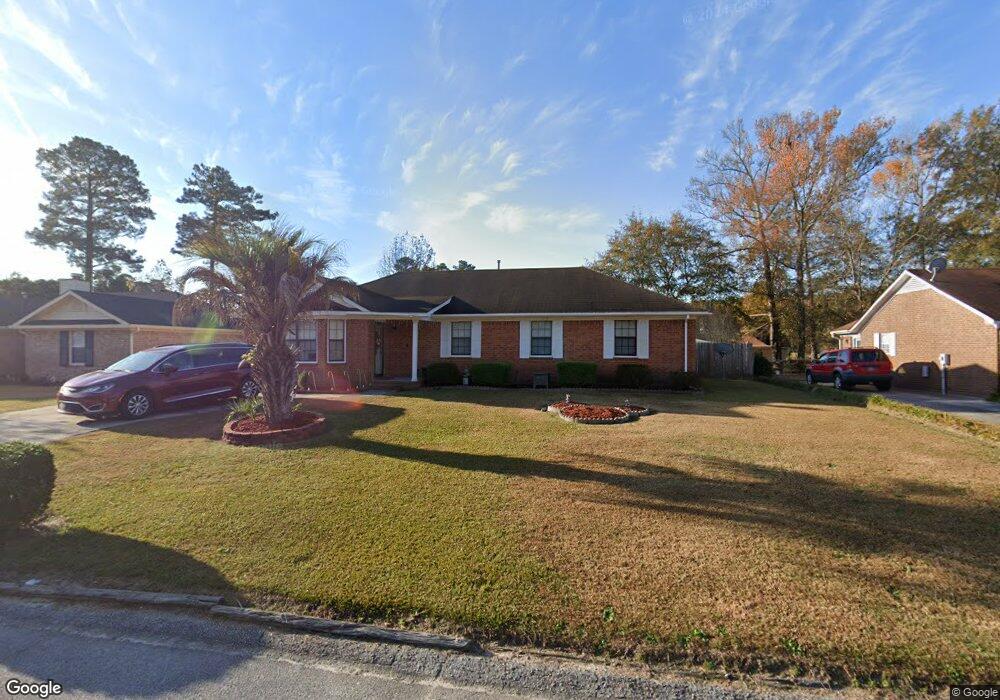
3499 Monte Carlo Dr Augusta, GA 30906
Pepperidge NeighborhoodEstimated Value: $176,314 - $198,000
3
Beds
2
Baths
1,624
Sq Ft
$118/Sq Ft
Est. Value
About This Home
This home is located at 3499 Monte Carlo Dr, Augusta, GA 30906 and is currently estimated at $191,579, approximately $117 per square foot. 3499 Monte Carlo Dr is a home located in Richmond County with nearby schools including Richmond Hill K-8, Tobacco Road Elementary School, and Johnson Magnet.
Ownership History
Date
Name
Owned For
Owner Type
Purchase Details
Closed on
Aug 13, 2021
Sold by
Rios Randall
Bought by
Rios Randall and Rios Karen
Current Estimated Value
Purchase Details
Closed on
Oct 30, 2002
Sold by
Va
Bought by
Rios Randall
Home Financials for this Owner
Home Financials are based on the most recent Mortgage that was taken out on this home.
Original Mortgage
$72,000
Interest Rate
5.98%
Mortgage Type
Purchase Money Mortgage
Purchase Details
Closed on
Jun 4, 2002
Sold by
Olsen Michael Rae
Bought by
Regions Mtg Inc and Real Estate Financing Inc
Purchase Details
Closed on
Jul 23, 1997
Sold by
Olsen Michael Rae By Atty
Bought by
Olsen Michael Rae Olsen Annette
Purchase Details
Closed on
Aug 27, 1992
Sold by
Rollins Donally J
Bought by
Olsen Michsel Rae
Purchase Details
Closed on
May 1, 1988
Sold by
Lowe Allen E
Bought by
Rollins Donally J
Purchase Details
Closed on
Dec 1, 1985
Create a Home Valuation Report for This Property
The Home Valuation Report is an in-depth analysis detailing your home's value as well as a comparison with similar homes in the area
Home Values in the Area
Average Home Value in this Area
Purchase History
| Date | Buyer | Sale Price | Title Company |
|---|---|---|---|
| Rios Randall | -- | -- | |
| Rios Randall | $72,000 | -- | |
| Rios Randall | -- | -- | |
| Regions Mtg Inc | $63,954 | -- | |
| Regions Mortgage Inc | $64,000 | -- | |
| Olsen Michael Rae Olsen Annette | -- | -- | |
| Olsen Michsel Rae | $67,000 | -- | |
| Rollins Donally J | $59,900 | -- | |
| -- | $63,900 | -- |
Source: Public Records
Mortgage History
| Date | Status | Borrower | Loan Amount |
|---|---|---|---|
| Previous Owner | Rios Randall | $72,000 |
Source: Public Records
Tax History
| Year | Tax Paid | Tax Assessment Tax Assessment Total Assessment is a certain percentage of the fair market value that is determined by local assessors to be the total taxable value of land and additions on the property. | Land | Improvement |
|---|---|---|---|---|
| 2025 | $2,013 | $57,424 | $7,380 | $50,044 |
| 2024 | $2,013 | $66,488 | $7,380 | $59,108 |
| 2023 | $2,181 | $57,144 | $7,380 | $49,764 |
| 2022 | $1,892 | $53,447 | $7,380 | $46,067 |
| 2021 | $1,413 | $33,116 | $7,380 | $25,736 |
| 2020 | $1,394 | $33,116 | $7,380 | $25,736 |
| 2019 | $1,467 | $33,116 | $7,380 | $25,736 |
| 2018 | $1,481 | $33,285 | $7,380 | $25,905 |
| 2017 | $1,426 | $33,285 | $7,380 | $25,905 |
| 2016 | $1,427 | $33,285 | $7,380 | $25,905 |
| 2015 | $1,436 | $33,285 | $7,380 | $25,905 |
| 2014 | $1,415 | $32,610 | $7,380 | $25,230 |
Source: Public Records
Map
Nearby Homes
- 3622 Seelye Dr
- 3611 Kentwood Dr Unit 1
- 2113 Chadwick Rd
- 3545 Monte Carlo Dr
- 3525 Stoney Brook Rd
- 3708 Lexington Dr
- 2115 Ashley Dr
- 2101 Rosier Rd
- 2152 Rosier Rd
- 2165 Rosier Rd
- 3606 Greiner Dr
- 3507 Custis Ct
- 3414 Sutton Place
- 3412 Sutton Place
- 3604 Concord Ct
- 3406 Linderwood Dr
- 3601 Concord Ct
- 3434 Thames Place
- 2104 Oakleaf Way
- 3505 Rushing Rd
- 3501 Monte Carlo Dr
- 3497 Monte Carlo Dr
- 3605 Seelye Dr
- 3503 Monte Carlo Dr
- 3607 Seelye Dr
- 3603 Seelye Dr
- 3495 Monte Carlo Dr
- 3498 Monte Carlo Dr
- 3493 Monte Carlo Dr
- 3496 Monte Carlo Dr
- 3502 Monte Carlo Dr
- 3609 Seelye Dr
- 3494 Monte Carlo Dr
- 3505 Monte Carlo Dr
- 3502 Monte Carlo Dr
- 3491 Monte Carlo Dr
- 3611 Seelye Dr
- 3504 Monte Carlo Dr
- 3492 Monte Carlo Dr
- 3490 Monte Carlo Dr
Your Personal Tour Guide
Ask me questions while you tour the home.