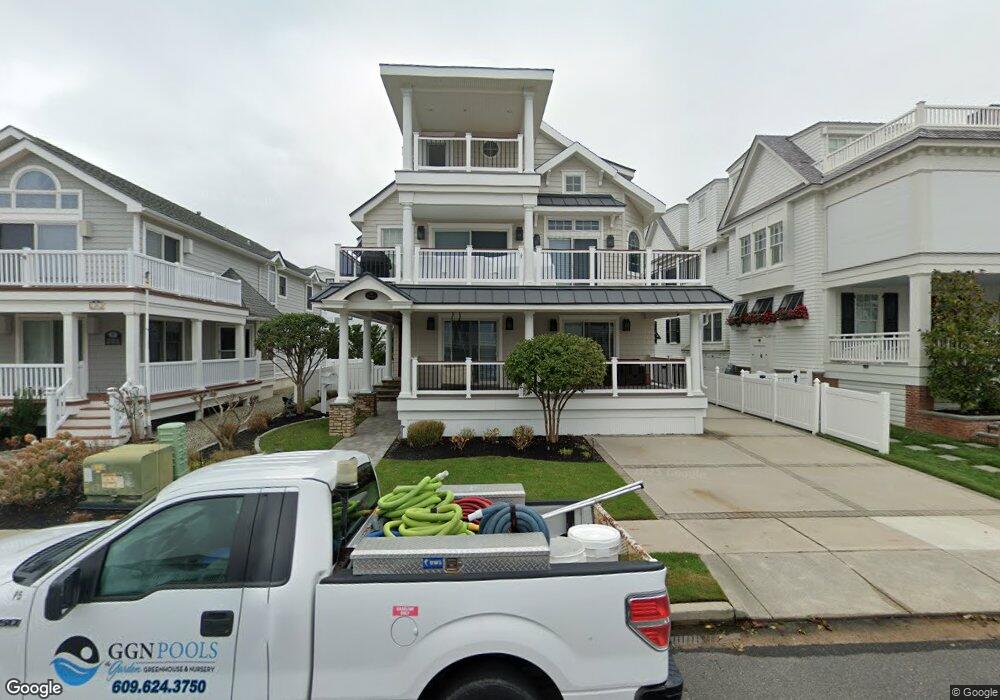
35 13th St W Avalon, NJ 08202
Estimated Value: $2,827,854 - $4,260,000
Studio
--
Bath
1,920
Sq Ft
$1,696/Sq Ft
Est. Value
About This Home
This home is located at 35 13th St W, Avalon, NJ 08202 and is currently estimated at $3,255,714, approximately $1,695 per square foot. 35 13th St W is a home located in Cape May County with nearby schools including Avalon Elementary School.
Ownership History
Date
Name
Owned For
Owner Type
Purchase Details
Closed on
Feb 7, 2018
Sold by
Ryan James J and Ryan Leslie A
Bought by
Mullen Kathryn M and Mullin Stephen A
Current Estimated Value
Home Financials for this Owner
Home Financials are based on the most recent Mortgage that was taken out on this home.
Original Mortgage
$1,460,000
Outstanding Balance
$1,236,488
Interest Rate
3.99%
Mortgage Type
Purchase Money Mortgage
Estimated Equity
$2,019,226
Purchase Details
Closed on
Jul 27, 2007
Sold by
Soens Mary T
Bought by
Ryan James J and Ryan Leslie A
Home Financials for this Owner
Home Financials are based on the most recent Mortgage that was taken out on this home.
Original Mortgage
$147,500
Interest Rate
6.72%
Mortgage Type
Credit Line Revolving
Purchase Details
Closed on
Aug 11, 1991
Sold by
Millikan Michael and Millikan Barbara
Bought by
Mulhern Charles B and Mulhern Mary T
Create a Home Valuation Report for This Property
The Home Valuation Report is an in-depth analysis detailing your home's value as well as a comparison with similar homes in the area
Home Values in the Area
Average Home Value in this Area
Purchase History
| Date | Buyer | Sale Price | Title Company |
|---|---|---|---|
| Mullen Kathryn M | $1,825,000 | -- | |
| Ryan James J | $1,275,000 | None Available | |
| Soens Mary Theresa | -- | None Available | |
| Mulhern Charles B | $304,000 | -- |
Source: Public Records
Mortgage History
| Date | Status | Borrower | Loan Amount |
|---|---|---|---|
| Open | Mullen Kathryn M | $1,460,000 | |
| Previous Owner | Soens Mary Theresa | $147,500 | |
| Previous Owner | Ryan James J | $1,000,000 |
Source: Public Records
Tax History
| Year | Tax Paid | Tax Assessment Tax Assessment Total Assessment is a certain percentage of the fair market value that is determined by local assessors to be the total taxable value of land and additions on the property. | Land | Improvement |
|---|---|---|---|---|
| 2025 | $7,683 | $1,251,300 | $1,200,000 | $51,300 |
| 2024 | $7,683 | $1,251,300 | $1,200,000 | $51,300 |
| 2023 | $7,620 | $1,251,300 | $1,200,000 | $51,300 |
| 2022 | $7,107 | $1,251,300 | $1,200,000 | $51,300 |
| 2021 | $6,845 | $1,251,300 | $1,200,000 | $51,300 |
| 2020 | $6,582 | $1,251,300 | $1,200,000 | $51,300 |
| 2019 | $6,382 | $1,251,300 | $1,200,000 | $51,300 |
| 2018 | $6,106 | $1,251,300 | $1,200,000 | $51,300 |
| 2017 | $5,406 | $972,300 | $900,000 | $72,300 |
| 2016 | $5,348 | $972,300 | $900,000 | $72,300 |
| 2015 | $5,260 | $972,300 | $900,000 | $72,300 |
| 2014 | $5,202 | $972,300 | $900,000 | $72,300 |
Source: Public Records
Map
Nearby Homes
- 34 13th St W
- 74 13th St W
- 40 15th St W
- 1018 First Ave
- 82 9th St W
- 859 Dune Dr
- 700 First Ave Unit 305
- 700 First Ave Unit 215
- 74 7th St W
- 174 17th St
- 285 14th St Unit 285
- 285 14th St
- 1100 Ocean Dr Unit 312
- 181 7th St
- 16 4th Ave
- 178 19th St
- 1668 Ocean Dr Unit B1
- 2023 Dune Dr Unit R6
- 700 Ocean Dr Unit F5
- 283 6th St
Your Personal Tour Guide
Ask me questions while you tour the home.