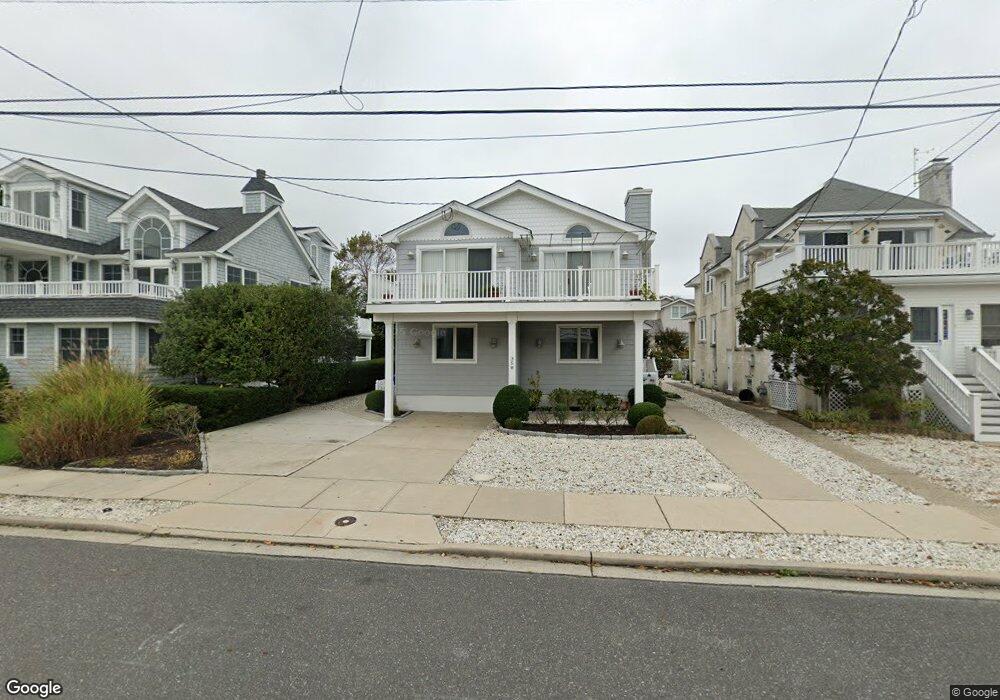
35 23rd St W Avalon, NJ 08202
Estimated Value: $3,101,000 - $3,960,000
--
Bed
--
Bath
2,772
Sq Ft
$1,286/Sq Ft
Est. Value
About This Home
This home is located at 35 23rd St W, Avalon, NJ 08202 and is currently estimated at $3,564,092, approximately $1,285 per square foot. 35 23rd St W is a home located in Cape May County with nearby schools including Avalon Elementary School.
Ownership History
Date
Name
Owned For
Owner Type
Purchase Details
Closed on
Jul 30, 2007
Sold by
Carter Edward P and Carter Kathleen D
Bought by
Carter Edward P
Current Estimated Value
Purchase Details
Closed on
Jan 13, 1996
Sold by
Comstock George
Bought by
Carter Edward and Carter Kathleen
Home Financials for this Owner
Home Financials are based on the most recent Mortgage that was taken out on this home.
Original Mortgage
$300,000
Outstanding Balance
$8,111
Interest Rate
7.31%
Estimated Equity
$3,555,981
Purchase Details
Closed on
Aug 11, 1989
Sold by
Mullray Joseph and Mullray Marion
Bought by
Comstock George and Comstock Elizabeth
Create a Home Valuation Report for This Property
The Home Valuation Report is an in-depth analysis detailing your home's value as well as a comparison with similar homes in the area
Home Values in the Area
Average Home Value in this Area
Purchase History
| Date | Buyer | Sale Price | Title Company |
|---|---|---|---|
| Carter Edward P | -- | None Available | |
| Carter Edward | $410,000 | -- | |
| Comstock George | $445,000 | -- |
Source: Public Records
Mortgage History
| Date | Status | Borrower | Loan Amount |
|---|---|---|---|
| Open | Carter Edward | $300,000 |
Source: Public Records
Tax History Compared to Growth
Tax History
| Year | Tax Paid | Tax Assessment Tax Assessment Total Assessment is a certain percentage of the fair market value that is determined by local assessors to be the total taxable value of land and additions on the property. | Land | Improvement |
|---|---|---|---|---|
| 2025 | $9,562 | $1,557,400 | $1,200,000 | $357,400 |
| 2024 | $9,562 | $1,557,400 | $1,200,000 | $357,400 |
| 2023 | $9,485 | $1,557,400 | $1,200,000 | $357,400 |
| 2022 | $8,846 | $1,557,400 | $1,200,000 | $357,400 |
| 2021 | $8,519 | $1,557,400 | $1,200,000 | $357,400 |
| 2020 | $8,192 | $1,557,400 | $1,200,000 | $357,400 |
| 2019 | $7,943 | $1,557,400 | $1,200,000 | $357,400 |
| 2018 | $7,600 | $1,557,400 | $1,200,000 | $357,400 |
| 2017 | $6,891 | $1,239,300 | $900,000 | $339,300 |
| 2016 | $6,816 | $1,239,300 | $900,000 | $339,300 |
| 2015 | $6,705 | $1,239,300 | $900,000 | $339,300 |
| 2014 | $6,630 | $1,239,300 | $900,000 | $339,300 |
Source: Public Records
Map
Nearby Homes