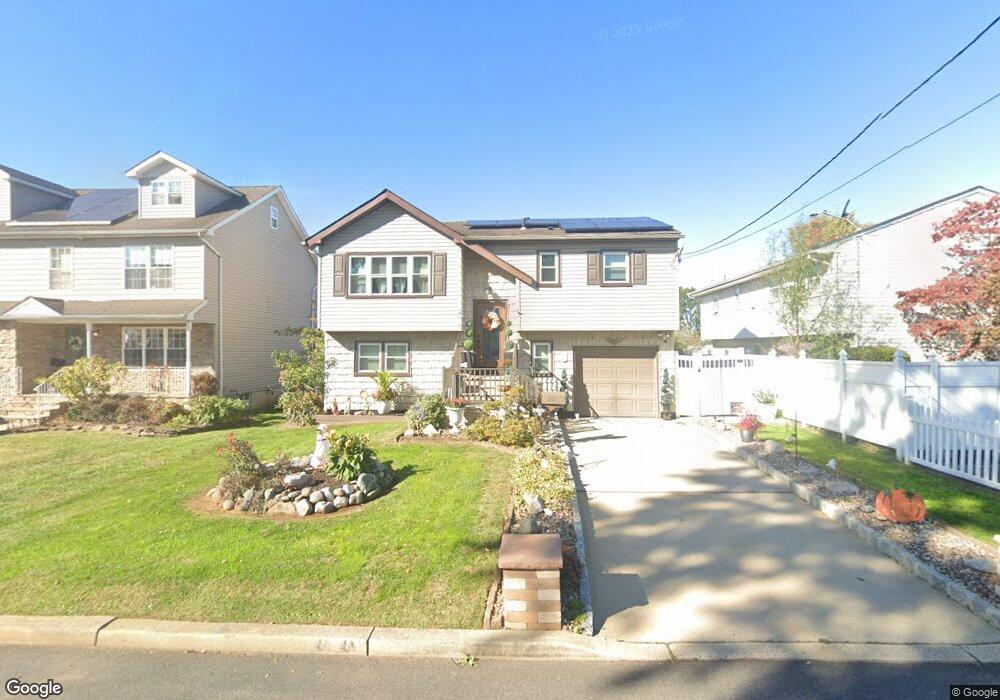
35 4th Ave Port Reading, NJ 07064
Estimated Value: $306,759 - $557,000
--
Bed
--
Bath
964
Sq Ft
$499/Sq Ft
Est. Value
About This Home
This home is located at 35 4th Ave, Port Reading, NJ 07064 and is currently estimated at $480,940, approximately $498 per square foot. 35 4th Ave is a home located in Middlesex County with nearby schools including Matthew Jago Elementary School, Avenel Middle School, and Woodbridge High School.
Ownership History
Date
Name
Owned For
Owner Type
Purchase Details
Closed on
Dec 8, 2020
Sold by
Rovinsky Robert L
Bought by
Rovinsky Robert L and Rovinsky Robert A
Current Estimated Value
Home Financials for this Owner
Home Financials are based on the most recent Mortgage that was taken out on this home.
Original Mortgage
$237,000
Interest Rate
2.7%
Mortgage Type
New Conventional
Purchase Details
Closed on
Jan 22, 1982
Bought by
Rovinsky Robert and Rovinsky Susan
Create a Home Valuation Report for This Property
The Home Valuation Report is an in-depth analysis detailing your home's value as well as a comparison with similar homes in the area
Home Values in the Area
Average Home Value in this Area
Purchase History
| Date | Buyer | Sale Price | Title Company |
|---|---|---|---|
| Rovinsky Robert L | -- | Advantage Title Llc | |
| Rovinsky Robert A | -- | Advantage Title | |
| Rovinsky Robert | $74,900 | -- |
Source: Public Records
Mortgage History
| Date | Status | Borrower | Loan Amount |
|---|---|---|---|
| Previous Owner | Rovinsky Robert A | $237,000 |
Source: Public Records
Tax History Compared to Growth
Tax History
| Year | Tax Paid | Tax Assessment Tax Assessment Total Assessment is a certain percentage of the fair market value that is determined by local assessors to be the total taxable value of land and additions on the property. | Land | Improvement |
|---|---|---|---|---|
| 2025 | $9,836 | $75,700 | $18,000 | $57,700 |
| 2024 | $9,542 | $75,700 | $18,000 | $57,700 |
| 2023 | $9,542 | $75,700 | $18,000 | $57,700 |
| 2022 | $9,300 | $75,700 | $18,000 | $57,700 |
| 2021 | $8,386 | $75,700 | $18,000 | $57,700 |
| 2020 | $8,609 | $75,700 | $18,000 | $57,700 |
| 2019 | $8,357 | $75,700 | $18,000 | $57,700 |
| 2018 | $8,183 | $75,700 | $18,000 | $57,700 |
| 2017 | $8,013 | $75,700 | $18,000 | $57,700 |
| 2016 | $8,181 | $75,700 | $18,000 | $57,700 |
| 2015 | $7,762 | $75,700 | $18,000 | $57,700 |
| 2014 | $7,555 | $75,700 | $18,000 | $57,700 |
Source: Public Records
Map
Nearby Homes