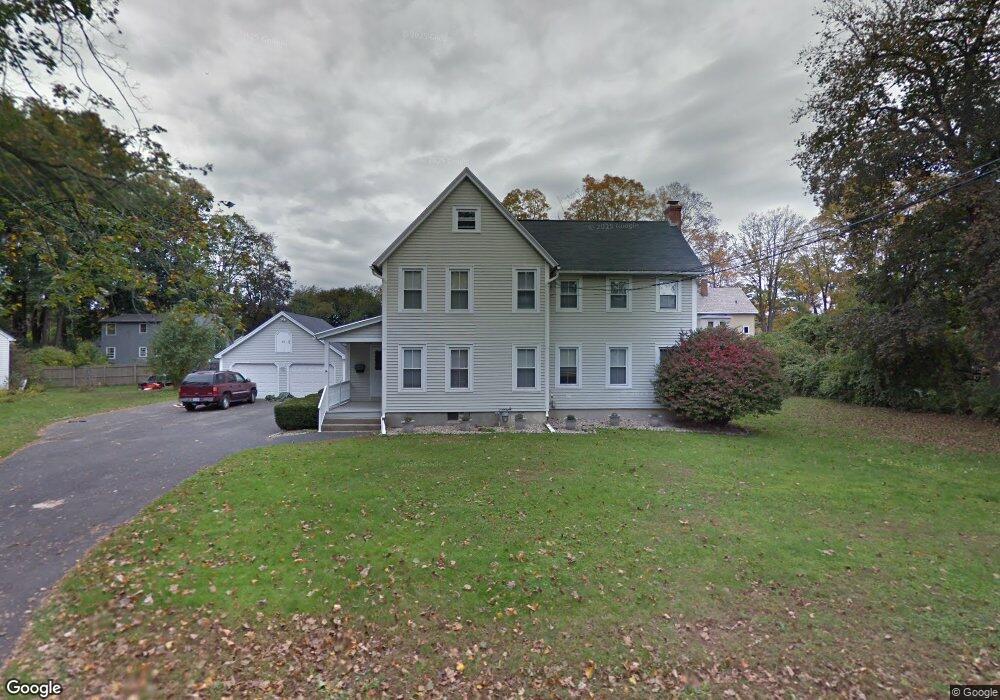
35 Allen Ave Westfield, MA 01085
Estimated Value: $380,000 - $417,000
4
Beds
3
Baths
2,289
Sq Ft
$172/Sq Ft
Est. Value
About This Home
This home is located at 35 Allen Ave, Westfield, MA 01085 and is currently estimated at $393,576, approximately $171 per square foot. 35 Allen Ave is a home located in Hampden County with nearby schools including Westfield High School and Saint Mary High School.
Ownership History
Date
Name
Owned For
Owner Type
Purchase Details
Closed on
Apr 2, 2008
Sold by
Sabourin David L and Janisieski Diane M
Bought by
Tatro Gregg E and Couture Sarah A
Current Estimated Value
Home Financials for this Owner
Home Financials are based on the most recent Mortgage that was taken out on this home.
Original Mortgage
$240,000
Outstanding Balance
$152,742
Interest Rate
6.06%
Mortgage Type
Purchase Money Mortgage
Estimated Equity
$240,834
Purchase Details
Closed on
May 12, 1995
Sold by
Muldoon Daniel and Langevin John S
Bought by
Sabourin David L and Janisieski Diane M
Purchase Details
Closed on
Nov 23, 1994
Sold by
Benton Roger A and Benton Christine R
Bought by
Muldoon Daniel and Langevin John S
Create a Home Valuation Report for This Property
The Home Valuation Report is an in-depth analysis detailing your home's value as well as a comparison with similar homes in the area
Home Values in the Area
Average Home Value in this Area
Purchase History
| Date | Buyer | Sale Price | Title Company |
|---|---|---|---|
| Tatro Gregg E | $240,000 | -- | |
| Sabourin David L | $116,000 | -- | |
| Muldoon Daniel | $40,000 | -- |
Source: Public Records
Mortgage History
| Date | Status | Borrower | Loan Amount |
|---|---|---|---|
| Open | Tatro Gregg E | $240,000 | |
| Previous Owner | Muldoon Daniel | $157,000 | |
| Previous Owner | Muldoon Daniel | $35,050 | |
| Previous Owner | Muldoon Daniel | $124,500 |
Source: Public Records
Tax History Compared to Growth
Tax History
| Year | Tax Paid | Tax Assessment Tax Assessment Total Assessment is a certain percentage of the fair market value that is determined by local assessors to be the total taxable value of land and additions on the property. | Land | Improvement |
|---|---|---|---|---|
| 2025 | $4,949 | $326,000 | $99,400 | $226,600 |
| 2024 | $4,786 | $299,700 | $90,600 | $209,100 |
| 2023 | $4,598 | $270,800 | $86,100 | $184,700 |
| 2022 | $4,434 | $239,800 | $76,900 | $162,900 |
| 2021 | $4,280 | $226,700 | $72,600 | $154,100 |
| 2020 | $4,154 | $215,800 | $72,600 | $143,200 |
| 2019 | $3,948 | $200,700 | $69,000 | $131,700 |
| 2018 | $3,996 | $200,700 | $69,000 | $131,700 |
| 2017 | $3,835 | $197,500 | $70,000 | $127,500 |
| 2016 | $3,839 | $197,500 | $70,000 | $127,500 |
| 2015 | $3,662 | $197,500 | $70,000 | $127,500 |
| 2014 | $2,738 | $197,500 | $70,000 | $127,500 |
Source: Public Records
Map
Nearby Homes