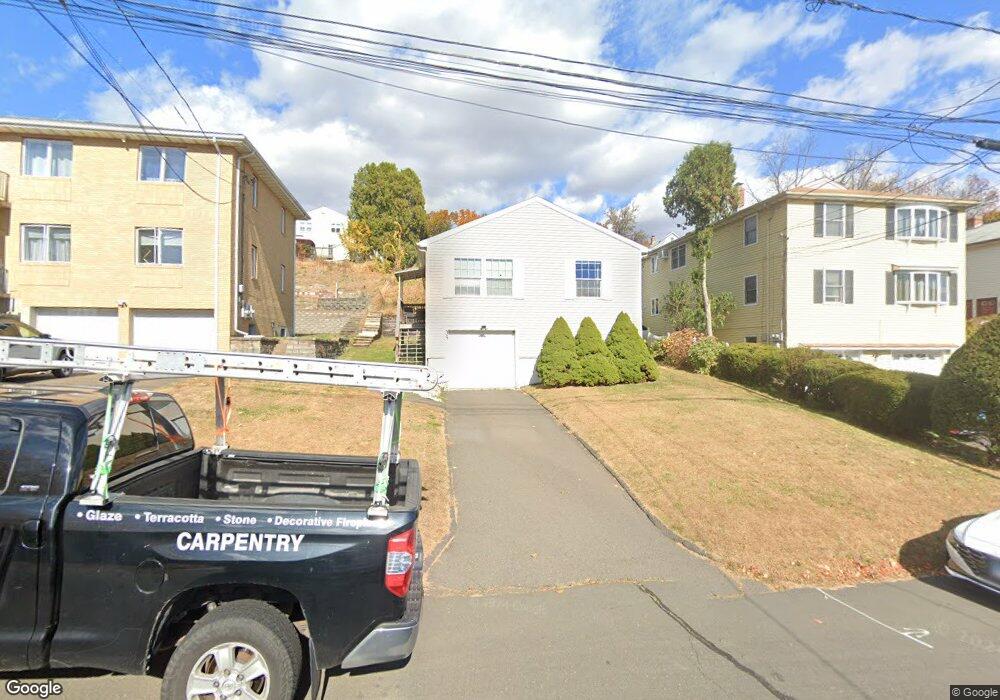
35 Arlington St New Britain, CT 06053
Estimated Value: $246,000 - $295,662
3
Beds
2
Baths
1,144
Sq Ft
$245/Sq Ft
Est. Value
About This Home
This home is located at 35 Arlington St, New Britain, CT 06053 and is currently estimated at $279,916, approximately $244 per square foot. 35 Arlington St is a home located in Hartford County with nearby schools including Jefferson School, Pulaski Middle School, and Mountain Laurel Sudbury School.
Ownership History
Date
Name
Owned For
Owner Type
Purchase Details
Closed on
Sep 18, 2002
Sold by
Equicredit Corp Americ
Bought by
Wolicki Jan and Wolicki Barbara
Current Estimated Value
Home Financials for this Owner
Home Financials are based on the most recent Mortgage that was taken out on this home.
Original Mortgage
$110,100
Outstanding Balance
$46,395
Interest Rate
6.36%
Estimated Equity
$233,521
Purchase Details
Closed on
Dec 29, 1999
Sold by
Opm Siracusa Hldgs Llc
Bought by
Wiggins Gene and Wiggins Bormard
Home Financials for this Owner
Home Financials are based on the most recent Mortgage that was taken out on this home.
Original Mortgage
$105,000
Interest Rate
7.71%
Purchase Details
Closed on
Jul 10, 1998
Sold by
Felder Irene
Bought by
Opm Siracusa Holdings
Home Financials for this Owner
Home Financials are based on the most recent Mortgage that was taken out on this home.
Original Mortgage
$21,000
Interest Rate
7.02%
Mortgage Type
Unknown
Create a Home Valuation Report for This Property
The Home Valuation Report is an in-depth analysis detailing your home's value as well as a comparison with similar homes in the area
Home Values in the Area
Average Home Value in this Area
Purchase History
| Date | Buyer | Sale Price | Title Company |
|---|---|---|---|
| Wolicki Jan | $111,000 | -- | |
| Wiggins Gene | $140,000 | -- | |
| Opm Siracusa Holdings | $16,000 | -- |
Source: Public Records
Mortgage History
| Date | Status | Borrower | Loan Amount |
|---|---|---|---|
| Open | Opm Siracusa Holdings | $110,100 | |
| Closed | Opm Siracusa Holdings | $8,300 | |
| Previous Owner | Opm Siracusa Holdings | $105,000 | |
| Previous Owner | Opm Siracusa Holdings | $21,000 |
Source: Public Records
Tax History Compared to Growth
Tax History
| Year | Tax Paid | Tax Assessment Tax Assessment Total Assessment is a certain percentage of the fair market value that is determined by local assessors to be the total taxable value of land and additions on the property. | Land | Improvement |
|---|---|---|---|---|
| 2025 | $5,732 | $146,300 | $48,860 | $97,440 |
| 2024 | $5,792 | $146,300 | $48,860 | $97,440 |
| 2023 | $5,600 | $146,300 | $48,860 | $97,440 |
| 2022 | $5,062 | $102,270 | $22,540 | $79,730 |
| 2021 | $5,062 | $102,270 | $22,540 | $79,730 |
| 2020 | $5,165 | $102,270 | $22,540 | $79,730 |
| 2019 | $5,165 | $102,270 | $22,540 | $79,730 |
| 2018 | $5,165 | $102,270 | $22,540 | $79,730 |
| 2017 | $5,069 | $100,380 | $20,510 | $79,870 |
| 2016 | $5,069 | $100,380 | $20,510 | $79,870 |
| 2015 | $4,919 | $100,380 | $20,510 | $79,870 |
| 2014 | $4,919 | $100,380 | $20,510 | $79,870 |
Source: Public Records
Map
Nearby Homes
- 527 Burritt St
- 55 Allen St
- 34 Concord St
- 474 Eddy Glover Blvd
- 50 Curtin Ave
- 107 Allen St
- 234 Pierremount Ave
- 108 Commonwealth Ave
- 152 Oakland Ave
- 7 Doris St
- 95 Pierremount Ave
- 410 Farmington Ave Unit O6
- 235 High St Unit C
- 14 Beatty St
- 240 Washington St
- 80 Gold St
- 262 Tremont St
- 394 Mcclintock St
- 56 Beatty St
- 179 Broad St
- 31 Arlington St
- 41 Arlington St
- 29 Arlington St
- 66 Biruta St
- 60 Biruta St Unit 62
- 70 Biruta St
- 25 Arlington St
- 56 Biruta St
- 74 Biruta St Unit 76
- 38 Arlington St
- 32 Arlington St
- 31 Marshall St
- 44 Arlington St
- 37 Marshall St Unit 39
- 21 Arlington St
- 26 Arlington St
- 45 Marshall St
- 43 Marshall St
- 50 Biruta St
- 50 Arlington St