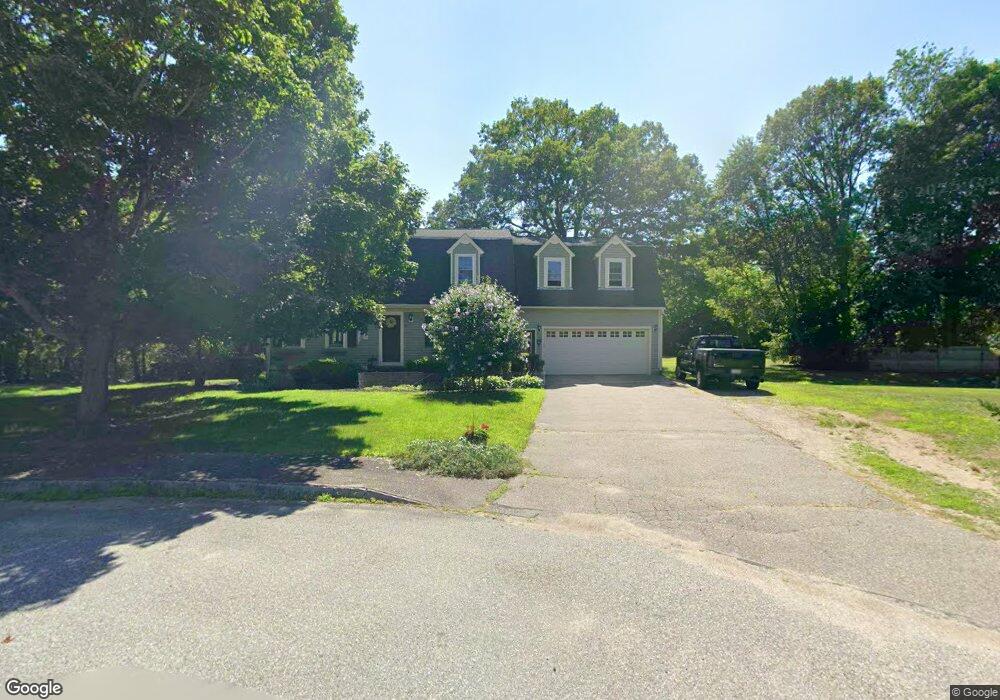
35 Atlantic Rd North Attleboro, MA 02760
North Attleboro NeighborhoodEstimated Value: $738,625 - $769,000
4
Beds
3
Baths
2,156
Sq Ft
$350/Sq Ft
Est. Value
About This Home
This home is located at 35 Atlantic Rd, North Attleboro, MA 02760 and is currently estimated at $753,656, approximately $349 per square foot. 35 Atlantic Rd is a home located in Bristol County with nearby schools including North Attleboro High School, Cadence Academy Preschool - North Attleborough, and St John The Evangelist School.
Ownership History
Date
Name
Owned For
Owner Type
Purchase Details
Closed on
May 19, 1993
Sold by
Fisher Stephen E and Fisher Marie D
Bought by
Lovejoy Thomas E and Lovejoy Roberta J
Current Estimated Value
Home Financials for this Owner
Home Financials are based on the most recent Mortgage that was taken out on this home.
Original Mortgage
$137,650
Interest Rate
7.54%
Mortgage Type
Purchase Money Mortgage
Create a Home Valuation Report for This Property
The Home Valuation Report is an in-depth analysis detailing your home's value as well as a comparison with similar homes in the area
Home Values in the Area
Average Home Value in this Area
Purchase History
| Date | Buyer | Sale Price | Title Company |
|---|---|---|---|
| Lovejoy Thomas E | $144,900 | -- |
Source: Public Records
Mortgage History
| Date | Status | Borrower | Loan Amount |
|---|---|---|---|
| Open | Lovejoy Thomas E | $80,000 | |
| Closed | Lovejoy Thomas E | $137,650 |
Source: Public Records
Tax History Compared to Growth
Tax History
| Year | Tax Paid | Tax Assessment Tax Assessment Total Assessment is a certain percentage of the fair market value that is determined by local assessors to be the total taxable value of land and additions on the property. | Land | Improvement |
|---|---|---|---|---|
| 2025 | $7,237 | $613,800 | $153,000 | $460,800 |
| 2024 | $6,866 | $595,000 | $153,000 | $442,000 |
| 2023 | $7,005 | $547,700 | $153,000 | $394,700 |
| 2022 | $6,466 | $464,200 | $153,000 | $311,200 |
| 2021 | $6,070 | $425,400 | $153,000 | $272,400 |
| 2020 | $5,912 | $412,000 | $153,000 | $259,000 |
| 2019 | $5,756 | $404,200 | $139,200 | $265,000 |
| 2018 | $5,117 | $383,600 | $139,200 | $244,400 |
| 2017 | $4,738 | $358,400 | $139,200 | $219,200 |
| 2016 | $4,439 | $335,800 | $154,700 | $181,100 |
| 2015 | $4,069 | $309,700 | $154,700 | $155,000 |
| 2014 | $3,796 | $286,700 | $135,700 | $151,000 |
Source: Public Records
Map
Nearby Homes