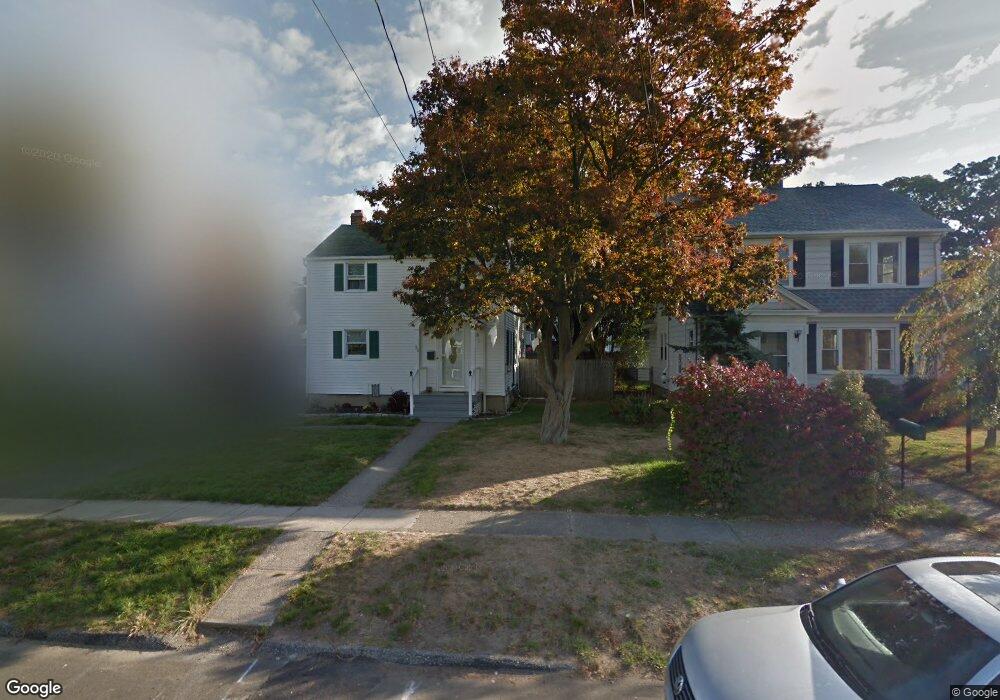
35 Baker St Milford, CT 06461
Devon NeighborhoodEstimated Value: $413,984 - $453,000
3
Beds
2
Baths
1,470
Sq Ft
$294/Sq Ft
Est. Value
About This Home
This home is located at 35 Baker St, Milford, CT 06461 and is currently estimated at $432,246, approximately $294 per square foot. 35 Baker St is a home located in New Haven County with nearby schools including J.F. Kennedy School, West Shore Middle School, and Jonathan Law High School.
Ownership History
Date
Name
Owned For
Owner Type
Purchase Details
Closed on
May 4, 2016
Sold by
Us Bank Na Tr
Bought by
Close Gregory and Close Tammy
Current Estimated Value
Home Financials for this Owner
Home Financials are based on the most recent Mortgage that was taken out on this home.
Original Mortgage
$170,845
Outstanding Balance
$136,226
Interest Rate
3.71%
Mortgage Type
VA
Estimated Equity
$296,020
Purchase Details
Closed on
Aug 22, 2005
Sold by
Nguyen Hiep P and Lee Gina
Bought by
Galligan Duani E and Galligan Lori-Ann
Purchase Details
Closed on
May 16, 2002
Sold by
Department Of Housing & Urban Dev
Bought by
Nguyen Hiep P and Lee Gina
Purchase Details
Closed on
Nov 17, 1998
Sold by
Wilcock Lisa B
Bought by
Wright Christopher
Create a Home Valuation Report for This Property
The Home Valuation Report is an in-depth analysis detailing your home's value as well as a comparison with similar homes in the area
Home Values in the Area
Average Home Value in this Area
Purchase History
We collect this data history from publicly available records. To have your information removed, we recommend requesting removal directly through your county’s website.
| Date | Buyer | Sale Price | Title Company |
|---|---|---|---|
| Close Gregory | $168,000 | -- | |
| Close Gregory | $168,000 | -- | |
| Galligan Duani E | $320,000 | -- | |
| Galligan Duani E | $320,000 | -- | |
| Nguyen Hiep P | $170,000 | -- | |
| Nguyen Hiep P | $170,000 | -- | |
| Wright Christopher | $134,000 | -- | |
| Wright Christopher | $134,000 | -- |
Source: Public Records
Mortgage History
We collect this data history from publicly available records. To have your information removed, we recommend requesting removal directly through your county’s website.
| Date | Status | Borrower | Loan Amount |
|---|---|---|---|
| Open | Close Gregory | $170,845 | |
| Closed | Close Gregory | $170,845 | |
| Previous Owner | Wright Christopher | $280,000 | |
| Previous Owner | Wright Christopher | $20,000 |
Source: Public Records
Tax History
| Year | Tax Paid | Tax Assessment Tax Assessment Total Assessment is a certain percentage of the fair market value that is determined by local assessors to be the total taxable value of land and additions on the property. | Land | Improvement |
|---|---|---|---|---|
| 2025 | $5,663 | $191,630 | $72,350 | $119,280 |
| 2024 | $5,584 | $191,630 | $72,350 | $119,280 |
| 2023 | $5,207 | $191,630 | $72,350 | $119,280 |
| 2022 | $5,107 | $191,630 | $72,350 | $119,280 |
| 2021 | $4,151 | $150,110 | $46,060 | $104,050 |
| 2020 | $4,155 | $150,110 | $46,060 | $104,050 |
| 2019 | $4,160 | $150,110 | $46,060 | $104,050 |
| 2018 | $4,164 | $150,110 | $46,060 | $104,050 |
| 2017 | $4,093 | $147,300 | $46,060 | $101,240 |
| 2016 | $4,416 | $158,630 | $46,060 | $112,570 |
| 2015 | $4,423 | $158,630 | $46,060 | $112,570 |
| 2014 | $4,318 | $158,630 | $46,060 | $112,570 |
Source: Public Records
Map
Nearby Homes
Your Personal Tour Guide
Ask me questions while you tour the home.