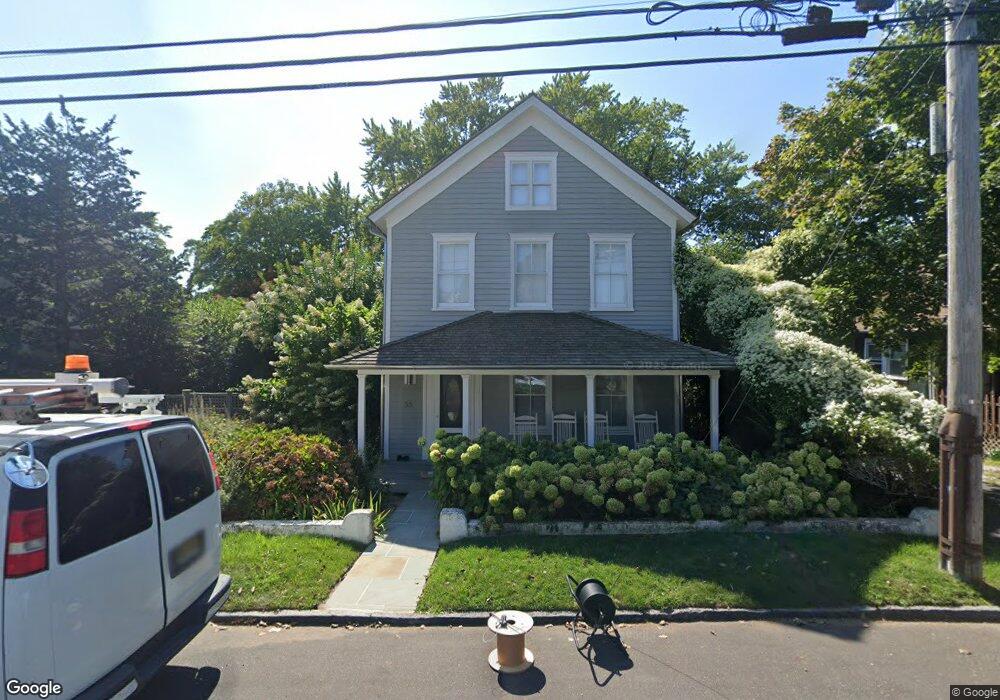
35 Bayview Ave Sag Harbor, NY 11963
Estimated Value: $2,924,000 - $4,068,376
3
Beds
2
Baths
2,035
Sq Ft
$1,754/Sq Ft
Est. Value
About This Home
This home is located at 35 Bayview Ave, Sag Harbor, NY 11963 and is currently estimated at $3,568,844, approximately $1,753 per square foot. 35 Bayview Ave is a home located in Suffolk County with nearby schools including Sag Harbor Elementary School, Pierson Middle/High School, and Ross Lower School.
Ownership History
Date
Name
Owned For
Owner Type
Purchase Details
Closed on
Aug 25, 2015
Sold by
Ford Beth E and Schurtz Jill E
Bought by
35 Bayview Avenue Llc
Current Estimated Value
Purchase Details
Closed on
Apr 1, 2010
Sold by
Gl1 Llc
Bought by
Ford Beth E and Schurtz Jill E
Home Financials for this Owner
Home Financials are based on the most recent Mortgage that was taken out on this home.
Original Mortgage
$800,000
Interest Rate
5.12%
Mortgage Type
Purchase Money Mortgage
Purchase Details
Closed on
Feb 6, 2008
Sold by
Levine Stanley
Bought by
Gl1 Llc
Purchase Details
Closed on
Dec 27, 2001
Sold by
Levine Ruth
Bought by
Levine Stanley
Home Financials for this Owner
Home Financials are based on the most recent Mortgage that was taken out on this home.
Original Mortgage
$250,000
Interest Rate
4.25%
Mortgage Type
Credit Line Revolving
Create a Home Valuation Report for This Property
The Home Valuation Report is an in-depth analysis detailing your home's value as well as a comparison with similar homes in the area
Home Values in the Area
Average Home Value in this Area
Purchase History
| Date | Buyer | Sale Price | Title Company |
|---|---|---|---|
| 35 Bayview Avenue Llc | $1,810,000 | None Available | |
| Ford Beth E | $1,150,000 | -- | |
| Gl1 Llc | $999,000 | Mark Catalano | |
| Gl1 Llc | $999,000 | Mark Catalano | |
| Levine Stanley | -- | Title Associates Inc |
Source: Public Records
Mortgage History
| Date | Status | Borrower | Loan Amount |
|---|---|---|---|
| Previous Owner | Ford Beth E | $800,000 | |
| Previous Owner | Levine Stanley | $250,000 |
Source: Public Records
Tax History Compared to Growth
Tax History
| Year | Tax Paid | Tax Assessment Tax Assessment Total Assessment is a certain percentage of the fair market value that is determined by local assessors to be the total taxable value of land and additions on the property. | Land | Improvement |
|---|---|---|---|---|
| 2024 | $5,650 | $2,034,300 | $1,028,000 | $1,006,300 |
| 2023 | $5,595 | $2,034,300 | $1,028,000 | $1,006,300 |
| 2022 | $5,524 | $2,034,300 | $1,028,000 | $1,006,300 |
| 2021 | $6,430 | $2,353,400 | $1,028,000 | $1,325,400 |
| 2020 | $12,612 | $2,353,400 | $1,028,000 | $1,325,400 |
| 2019 | $18,842 | $0 | $0 | $0 |
| 2018 | -- | $2,163,900 | $1,028,000 | $1,135,900 |
| 2017 | $10,692 | $1,861,000 | $917,900 | $943,100 |
| 2016 | $9,345 | $1,563,900 | $734,300 | $829,600 |
| 2015 | -- | $1,192,100 | $734,300 | $457,800 |
| 2014 | -- | $1,192,100 | $734,300 | $457,800 |
Source: Public Records
Map
Nearby Homes