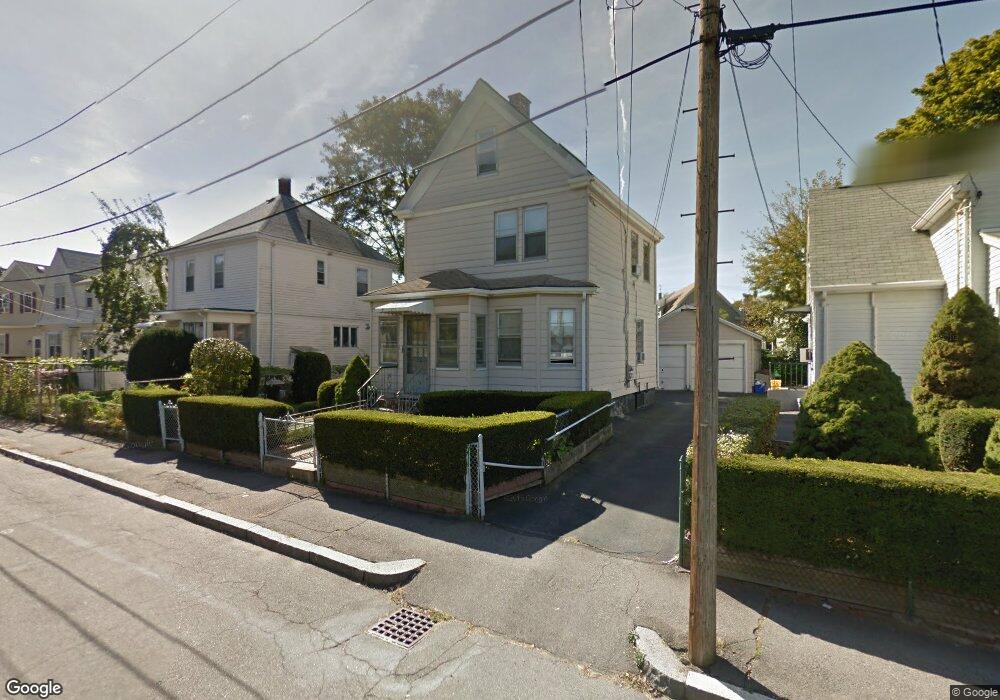
35 Birch St Quincy, MA 02171
North Quincy NeighborhoodEstimated Value: $708,000 - $934,000
3
Beds
2
Baths
1,332
Sq Ft
$589/Sq Ft
Est. Value
About This Home
This home is located at 35 Birch St, Quincy, MA 02171 and is currently estimated at $783,985, approximately $588 per square foot. 35 Birch St is a home located in Norfolk County with nearby schools including Francis W. Parker Elementary School, Atlantic Middle School, and North Quincy High School.
Ownership History
Date
Name
Owned For
Owner Type
Purchase Details
Closed on
Nov 6, 2014
Sold by
Keller Frank D
Bought by
Noland William E and Noland Madeleine R
Current Estimated Value
Home Financials for this Owner
Home Financials are based on the most recent Mortgage that was taken out on this home.
Original Mortgage
$231,000
Outstanding Balance
$178,121
Interest Rate
4.18%
Mortgage Type
New Conventional
Estimated Equity
$605,864
Purchase Details
Closed on
Jan 25, 2008
Sold by
Keller Ann and Keller Frank P
Bought by
Keller Frank D
Create a Home Valuation Report for This Property
The Home Valuation Report is an in-depth analysis detailing your home's value as well as a comparison with similar homes in the area
Home Values in the Area
Average Home Value in this Area
Purchase History
| Date | Buyer | Sale Price | Title Company |
|---|---|---|---|
| Noland William E | $330,000 | -- | |
| Keller Frank D | -- | -- |
Source: Public Records
Mortgage History
| Date | Status | Borrower | Loan Amount |
|---|---|---|---|
| Open | Noland William E | $231,000 |
Source: Public Records
Tax History Compared to Growth
Tax History
| Year | Tax Paid | Tax Assessment Tax Assessment Total Assessment is a certain percentage of the fair market value that is determined by local assessors to be the total taxable value of land and additions on the property. | Land | Improvement |
|---|---|---|---|---|
| 2025 | $7,378 | $639,900 | $345,500 | $294,400 |
| 2024 | $7,096 | $629,600 | $345,500 | $284,100 |
| 2023 | $6,290 | $565,100 | $314,100 | $251,000 |
| 2022 | $5,693 | $475,200 | $251,300 | $223,900 |
| 2021 | $5,368 | $442,200 | $251,300 | $190,900 |
| 2020 | $5,529 | $444,800 | $246,400 | $198,400 |
| 2019 | $5,272 | $420,100 | $236,900 | $183,200 |
| 2018 | $5,363 | $402,000 | $225,600 | $176,400 |
| 2017 | $5,003 | $353,100 | $205,100 | $148,000 |
| 2016 | $4,709 | $327,900 | $186,400 | $141,500 |
| 2015 | $4,656 | $318,900 | $169,500 | $149,400 |
| 2014 | $4,286 | $288,400 | $169,500 | $118,900 |
Source: Public Records
Map
Nearby Homes
- 85 E Squantum St Unit 10
- 17 Holmes St Unit 2
- 17 Holmes St Unit 4
- 6 Warwick St
- 522 Hancock St
- 58 Bayfield Rd S
- 115 W Squantum St Unit 907
- 115 W Squantum St Unit 810
- 38 Walker St
- 201 Billings St
- 11 Earle St
- 143 Arlington St
- 101 Beach St
- 297 Billings St
- 91 Atlantic St
- 250 Fayette St
- 68 Atlantic St
- 175 Quincy Shore Dr Unit B24
- 133 Commander Shea Blvd Unit 315
- 133 Commander Shea Blvd Unit 609
- 35 Birch St Unit 1
- 35 Birch St Unit lower
- 35 Birch St Unit 2
- 31 Birch St Unit 1
- 31 Birch St
- 39 Birch St
- 29 Birch St
- 262 Newbury Ave
- 43 Birch St
- 260 Newbury Ave
- 264 Newbury Ave
- 36 Birch St
- 266 Newbury Ave Unit 2
- 258 Newbury Ave
- 25 Birch St
- 66 Glover Ave Unit 66
- 66 Glover Ave Unit 64
- 66 Glover Ave
- 270 Newbury Ave
- 64 Glover Ave