


$99,000
- 3 Beds
- 2.5 Baths
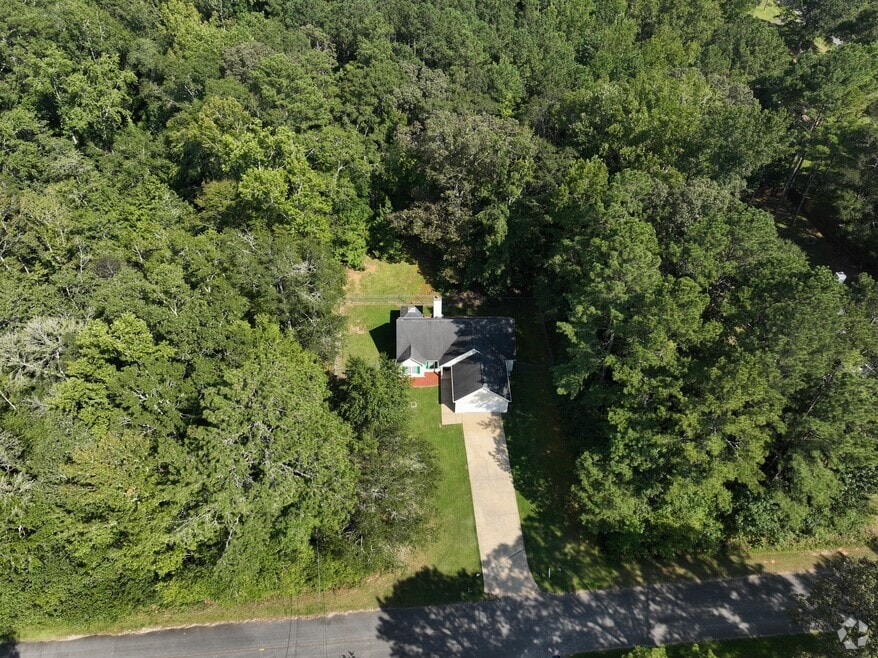
- 4701 Flat Shoals Rd
- Unit 59G
- Union City, GA
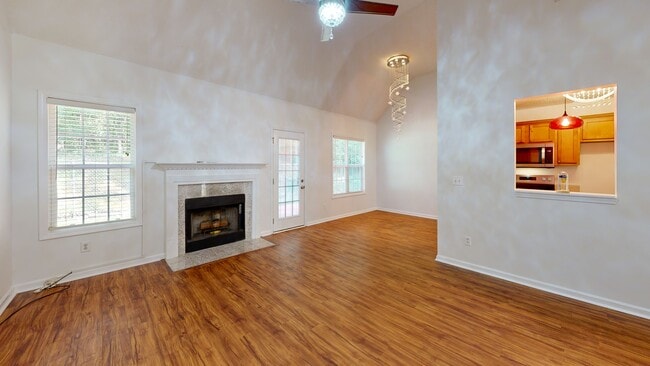
Move-in ready and perfectly located. This spacious 3-bedroom, 2.5-bath home is nestled in a gated community just 15 minutes from Hartsfield-Jackson International Airport. Step inside to find a bright and inviting layout with plenty of room for comfortable living and entertaining. Upstairs, you'll enjoy three generously sized bedrooms, including a private primary suite with its own bath. The
Philip Corley Keller Williams Realty Atl. Partners