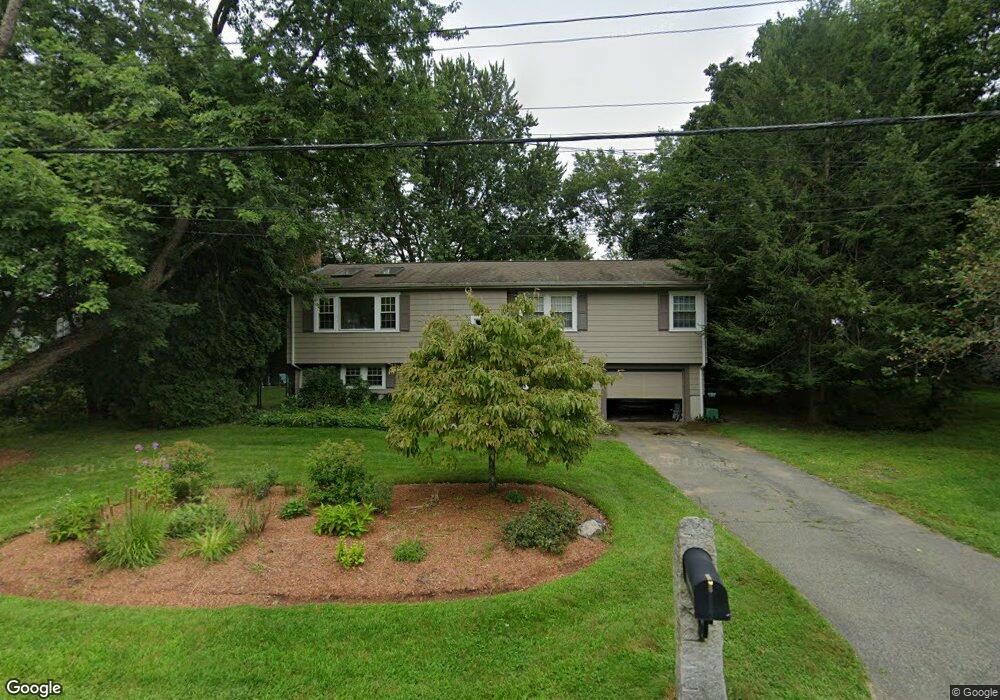
35 Brooks Rd Wayland, MA 01778
Estimated Value: $829,000 - $1,055,000
3
Beds
3
Baths
1,478
Sq Ft
$652/Sq Ft
Est. Value
About This Home
This home is located at 35 Brooks Rd, Wayland, MA 01778 and is currently estimated at $963,491, approximately $651 per square foot. 35 Brooks Rd is a home located in Middlesex County with nearby schools including Wayland High School, Veritas Christian Academy, and The Rivers School.
Ownership History
Date
Name
Owned For
Owner Type
Purchase Details
Closed on
May 29, 1992
Sold by
Damour David A and Damour Sue E
Bought by
Glick Lawrence K and Glick Carol S
Current Estimated Value
Create a Home Valuation Report for This Property
The Home Valuation Report is an in-depth analysis detailing your home's value as well as a comparison with similar homes in the area
Home Values in the Area
Average Home Value in this Area
Purchase History
| Date | Buyer | Sale Price | Title Company |
|---|---|---|---|
| Glick Lawrence K | $241,500 | -- |
Source: Public Records
Mortgage History
| Date | Status | Borrower | Loan Amount |
|---|---|---|---|
| Open | Glick Lawrence K | $282,000 | |
| Closed | Glick Lawrence K | $285,000 | |
| Closed | Glick Lawrence K | $180,000 |
Source: Public Records
Tax History Compared to Growth
Tax History
| Year | Tax Paid | Tax Assessment Tax Assessment Total Assessment is a certain percentage of the fair market value that is determined by local assessors to be the total taxable value of land and additions on the property. | Land | Improvement |
|---|---|---|---|---|
| 2025 | $13,787 | $882,100 | $543,100 | $339,000 |
| 2024 | $13,290 | $856,300 | $517,300 | $339,000 |
| 2023 | $12,897 | $774,600 | $470,300 | $304,300 |
| 2022 | $12,228 | $666,400 | $389,500 | $276,900 |
| 2021 | $11,349 | $627,300 | $354,100 | $273,200 |
| 2020 | $11,389 | $641,300 | $354,100 | $287,200 |
| 2019 | $10,842 | $593,100 | $337,300 | $255,800 |
| 2018 | $10,515 | $583,200 | $337,300 | $245,900 |
| 2017 | $56,007 | $560,700 | $327,100 | $233,600 |
| 2016 | $9,788 | $564,500 | $320,700 | $243,800 |
| 2015 | $10,157 | $552,300 | $320,700 | $231,600 |
Source: Public Records
Map
Nearby Homes
- 11 White Pine Knoll Rd
- 5 Brook Trail Rd
- 28 Joyce Rd
- 35 Snake Brook Rd
- 106 Willow Brook Dr Unit 106
- 62 E Plain St
- 125 Woodridge Rd
- 12 Nancy Rd
- 17 Smokey Hill Rd
- 3 Keith Rd
- 1 Winter St
- 9 French Ave
- 8 Frost St
- 177 Main St
- 260 Cochituate Rd
- 26 Dudley Rd
- 15 Crest Rd
- 14 Ferndale Rd
- 3 Ferndale Rd
- 37 Pequot Rd