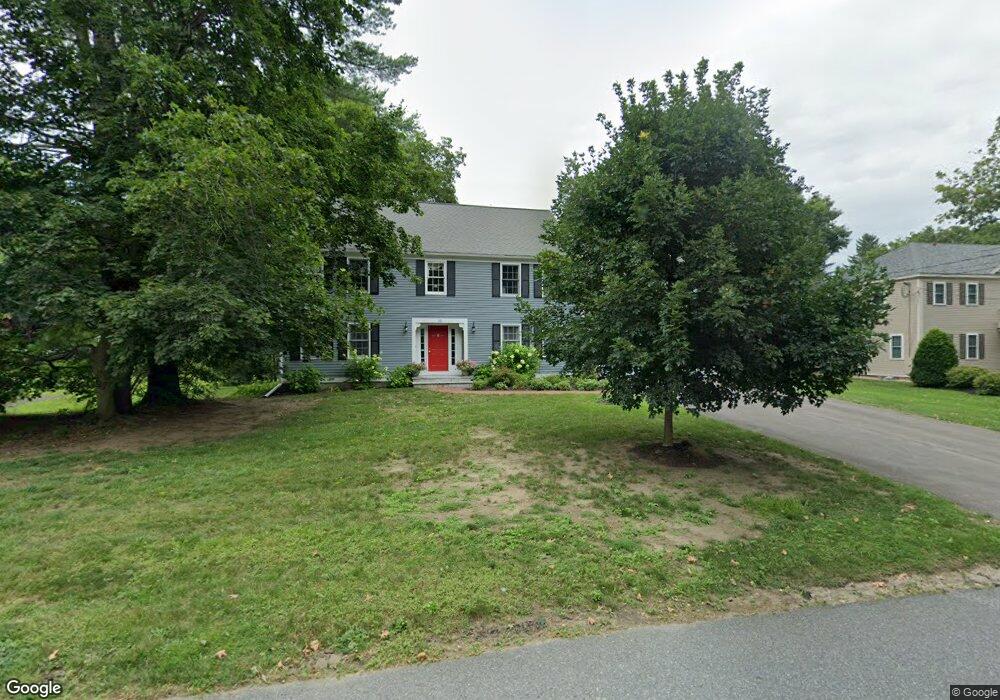
35 Bruce Rd Concord, MA 01742
Estimated Value: $1,219,000 - $2,073,000
4
Beds
3
Baths
3,472
Sq Ft
$509/Sq Ft
Est. Value
About This Home
This home is located at 35 Bruce Rd, Concord, MA 01742 and is currently estimated at $1,768,885, approximately $509 per square foot. 35 Bruce Rd is a home located in Middlesex County with nearby schools including Willard School, Concord Middle School, and Concord Carlisle High School.
Ownership History
Date
Name
Owned For
Owner Type
Purchase Details
Closed on
Jul 1, 2020
Sold by
Sobral-Traversi Patricia
Bought by
P Sobral Traversi 2018 T
Current Estimated Value
Purchase Details
Closed on
Feb 10, 1987
Sold by
Davis Madolyn S
Bought by
Lauzon James R
Create a Home Valuation Report for This Property
The Home Valuation Report is an in-depth analysis detailing your home's value as well as a comparison with similar homes in the area
Home Values in the Area
Average Home Value in this Area
Purchase History
| Date | Buyer | Sale Price | Title Company |
|---|---|---|---|
| P Sobral Traversi 2018 T | -- | None Available | |
| Lauzon James R | $185,000 | -- |
Source: Public Records
Mortgage History
| Date | Status | Borrower | Loan Amount |
|---|---|---|---|
| Previous Owner | Lauzon James R | $250,000 | |
| Previous Owner | Lauzon James R | $50,000 | |
| Previous Owner | Lauzon James R | $50,000 |
Source: Public Records
Tax History
| Year | Tax Paid | Tax Assessment Tax Assessment Total Assessment is a certain percentage of the fair market value that is determined by local assessors to be the total taxable value of land and additions on the property. | Land | Improvement |
|---|---|---|---|---|
| 2025 | $201 | $1,517,300 | $642,600 | $874,700 |
| 2024 | $20,051 | $1,527,100 | $642,600 | $884,500 |
| 2023 | $18,486 | $1,426,400 | $584,200 | $842,200 |
| 2022 | $17,032 | $1,153,900 | $467,300 | $686,600 |
| 2021 | $16,483 | $1,119,800 | $467,300 | $652,500 |
| 2020 | $16,100 | $1,131,400 | $467,300 | $664,100 |
| 2019 | $15,243 | $1,074,200 | $453,600 | $620,600 |
| 2018 | $14,920 | $1,044,100 | $432,000 | $612,100 |
| 2017 | $14,401 | $1,023,500 | $411,400 | $612,100 |
| 2016 | $14,338 | $1,030,000 | $411,400 | $618,600 |
| 2015 | $12,980 | $908,300 | $381,000 | $527,300 |
Source: Public Records
Map
Nearby Homes
- 236 Fairhaven Rd
- 25 Fairhaven Rd
- 165 Everett St
- 381 Thoreau St
- 143 Everett St
- 150 Hubbard St Unit B
- 22 Belknap Ct
- 181 Stow St
- 34 Thoreau St
- 34 Thoreau St Unit 34
- 32 Thoreau St Unit 32
- 46 Sudbury Rd
- 61B Walden St
- 265 Elsinore St
- 59 Elm St
- 105 Lexington Rd
- 106 Elm St
- 49 Willard Common
- 29 Willard Common
- 497 Old Road to 9 Acre Corner
Your Personal Tour Guide
Ask me questions while you tour the home.