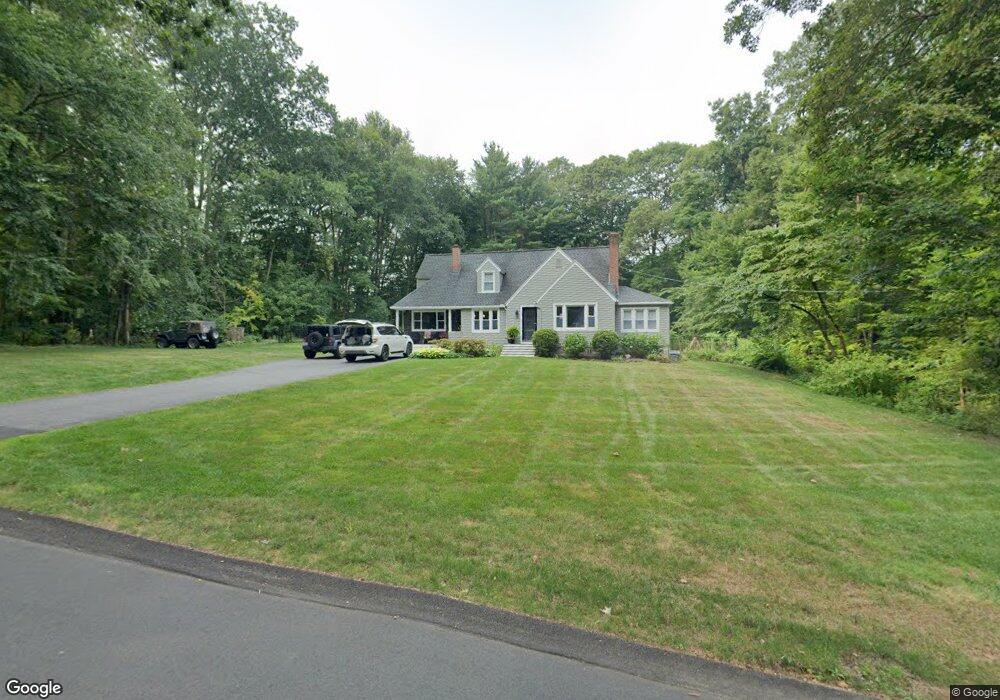
35 Burleigh Rd Wilbraham, MA 01095
Estimated Value: $460,875 - $541,000
3
Beds
2
Baths
1,745
Sq Ft
$286/Sq Ft
Est. Value
About This Home
This home is located at 35 Burleigh Rd, Wilbraham, MA 01095 and is currently estimated at $499,469, approximately $286 per square foot. 35 Burleigh Rd is a home located in Hampden County with nearby schools including Minnechaug Regional High School and Wilbraham & Monson Academy.
Ownership History
Date
Name
Owned For
Owner Type
Purchase Details
Closed on
Dec 1, 2016
Sold by
Tarpey Kerry A
Bought by
Grono Jennifer A
Current Estimated Value
Home Financials for this Owner
Home Financials are based on the most recent Mortgage that was taken out on this home.
Original Mortgage
$275,757
Outstanding Balance
$222,669
Interest Rate
3.52%
Mortgage Type
New Conventional
Estimated Equity
$276,800
Purchase Details
Closed on
Sep 1, 2015
Sold by
Kumpulanian Derek E
Bought by
Tarpey Kerry A
Purchase Details
Closed on
Nov 2, 2004
Sold by
Tarpey Kerry A
Bought by
Kumpulanian Derek E and Tarpey Kerry A
Home Financials for this Owner
Home Financials are based on the most recent Mortgage that was taken out on this home.
Original Mortgage
$244,800
Interest Rate
5.74%
Mortgage Type
Purchase Money Mortgage
Purchase Details
Closed on
Aug 5, 2003
Sold by
Fusco Joseph S
Bought by
Tarpey Kerry A
Home Financials for this Owner
Home Financials are based on the most recent Mortgage that was taken out on this home.
Original Mortgage
$247,000
Interest Rate
5.28%
Mortgage Type
Purchase Money Mortgage
Purchase Details
Closed on
Oct 26, 2001
Sold by
Queen Sharon
Bought by
Fusco Joseph S
Home Financials for this Owner
Home Financials are based on the most recent Mortgage that was taken out on this home.
Original Mortgage
$148,000
Interest Rate
6.86%
Mortgage Type
Purchase Money Mortgage
Create a Home Valuation Report for This Property
The Home Valuation Report is an in-depth analysis detailing your home's value as well as a comparison with similar homes in the area
Home Values in the Area
Average Home Value in this Area
Purchase History
| Date | Buyer | Sale Price | Title Company |
|---|---|---|---|
| Grono Jennifer A | $273,000 | -- | |
| Tarpey Kerry A | -- | -- | |
| Kumpulanian Derek E | -- | -- | |
| Tarpey Kerry A | $260,000 | -- | |
| Fusco Joseph S | $185,000 | -- |
Source: Public Records
Mortgage History
| Date | Status | Borrower | Loan Amount |
|---|---|---|---|
| Open | Grono Jennifer A | $275,757 | |
| Previous Owner | Kumpulanian Derek E | $244,800 | |
| Previous Owner | Tarpey Kerry A | $247,000 | |
| Previous Owner | Fusco Joseph S | $148,000 | |
| Previous Owner | Fusco Joseph S | $60,000 | |
| Previous Owner | Fusco Joseph S | $60,000 |
Source: Public Records
Tax History Compared to Growth
Tax History
| Year | Tax Paid | Tax Assessment Tax Assessment Total Assessment is a certain percentage of the fair market value that is determined by local assessors to be the total taxable value of land and additions on the property. | Land | Improvement |
|---|---|---|---|---|
| 2025 | $7,578 | $423,800 | $110,000 | $313,800 |
| 2024 | $7,026 | $379,800 | $110,000 | $269,800 |
| 2023 | $6,648 | $355,500 | $110,000 | $245,500 |
| 2022 | $6,958 | $339,600 | $110,000 | $229,600 |
| 2021 | $6,548 | $285,200 | $118,100 | $167,100 |
| 2020 | $6,383 | $285,200 | $118,100 | $167,100 |
| 2019 | $6,217 | $285,200 | $118,100 | $167,100 |
| 2018 | $5,742 | $253,600 | $118,100 | $135,500 |
| 2017 | $5,579 | $253,600 | $118,100 | $135,500 |
| 2016 | $5,536 | $256,300 | $131,200 | $125,100 |
| 2015 | $5,352 | $256,300 | $131,200 | $125,100 |
Source: Public Records
Map
Nearby Homes