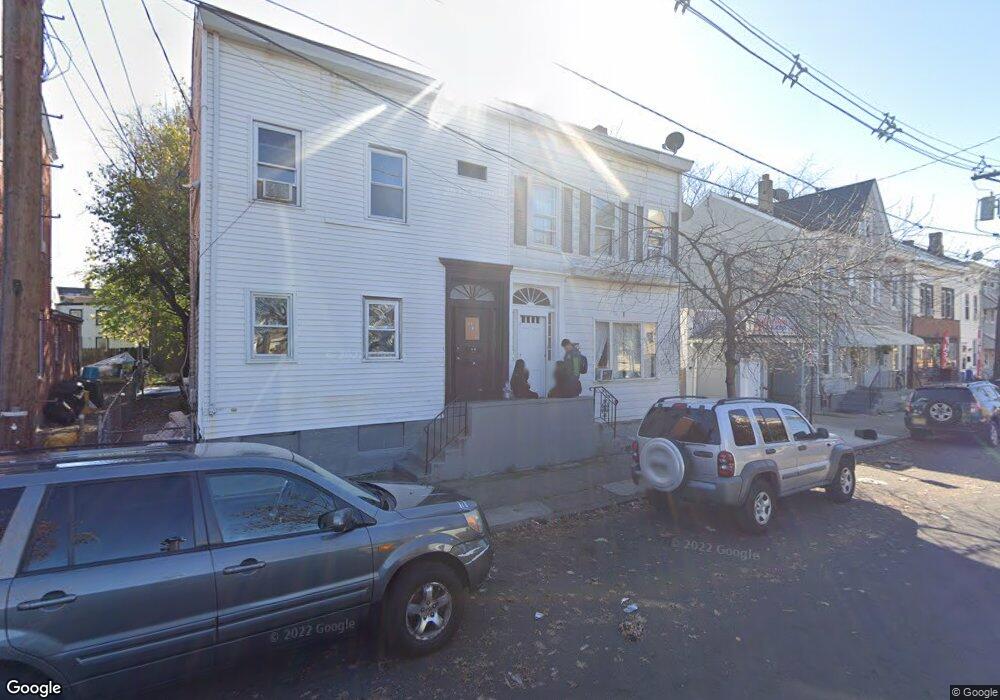
35 Butler St Trenton, NJ 08611
Chambersburg NeighborhoodEstimated Value: $211,000 - $331,000
3
Beds
2
Baths
2,072
Sq Ft
$123/Sq Ft
Est. Value
About This Home
This home is located at 35 Butler St, Trenton, NJ 08611 and is currently estimated at $254,935, approximately $123 per square foot. 35 Butler St is a home located in Mercer County with nearby schools including Robbins Elementary School, Monument Elementary School, and Dr. Martin Luther King Middle School.
Ownership History
Date
Name
Owned For
Owner Type
Purchase Details
Closed on
Aug 29, 2017
Sold by
Morgenstern Jonah
Bought by
George Mercer Lc
Current Estimated Value
Purchase Details
Closed on
Jul 13, 2011
Sold by
Green Baruch
Bought by
Morgenstern Jonah
Purchase Details
Closed on
Feb 3, 2010
Sold by
Green Baruch
Bought by
Greeeen Properties Llc and Green Baruch
Purchase Details
Closed on
Sep 12, 2006
Sold by
Bergman Naphtaly
Bought by
Green Baruch
Home Financials for this Owner
Home Financials are based on the most recent Mortgage that was taken out on this home.
Original Mortgage
$70,000
Interest Rate
6.59%
Purchase Details
Closed on
Aug 25, 2003
Sold by
Sharon Holdings Llc
Bought by
Bergman Maphtaly and Bergman Yoceved
Create a Home Valuation Report for This Property
The Home Valuation Report is an in-depth analysis detailing your home's value as well as a comparison with similar homes in the area
Home Values in the Area
Average Home Value in this Area
Purchase History
| Date | Buyer | Sale Price | Title Company |
|---|---|---|---|
| George Mercer Lc | $35,000 | Riverside Abstract Nj | |
| Morgenstern Jonah | $21,000 | Rosewood Realty Inc | |
| Green Baruch | -- | None Available | |
| Greeeen Properties Llc | -- | None Available | |
| Green Baruch | $87,500 | -- | |
| Bergman Maphtaly | $65,000 | -- |
Source: Public Records
Mortgage History
| Date | Status | Borrower | Loan Amount |
|---|---|---|---|
| Previous Owner | Green Baruch | $70,000 |
Source: Public Records
Tax History Compared to Growth
Tax History
| Year | Tax Paid | Tax Assessment Tax Assessment Total Assessment is a certain percentage of the fair market value that is determined by local assessors to be the total taxable value of land and additions on the property. | Land | Improvement |
|---|---|---|---|---|
| 2025 | $3,771 | $73,100 | $8,800 | $64,300 |
| 2024 | $3,619 | $65,000 | $5,000 | $60,000 |
| 2023 | $3,619 | $65,000 | $5,000 | $60,000 |
| 2022 | $3,548 | $65,000 | $5,000 | $60,000 |
| 2021 | $3,609 | $65,000 | $5,000 | $60,000 |
| 2020 | $3,598 | $65,000 | $5,000 | $60,000 |
| 2019 | $3,540 | $65,000 | $5,000 | $60,000 |
| 2018 | $3,811 | $73,100 | $8,800 | $64,300 |
| 2017 | $3,622 | $73,100 | $8,800 | $64,300 |
| 2016 | $4,159 | $72,300 | $18,500 | $53,800 |
| 2015 | $4,145 | $72,300 | $18,500 | $53,800 |
| 2014 | $4,125 | $72,300 | $18,500 | $53,800 |
Source: Public Records
Map
Nearby Homes
- 315 Hudson St
- 407 Hudson St
- 415 Hudson St
- 122 Butler St
- 162 Hamilton Ave
- 27 Tyler St
- 239 Butler St
- 230 S Clinton Ave
- 233 S Clinton Ave
- 238 Bayard St
- 234 Tyler St
- 826 S Clinton Ave
- 557 S Broad St
- 126 Second St
- 152 Division St
- 127 Kent St
- 242 Centre St Unit 6
- 242 Centre St Unit 1
- 27 Hollywood Ave
- 309 Centre St