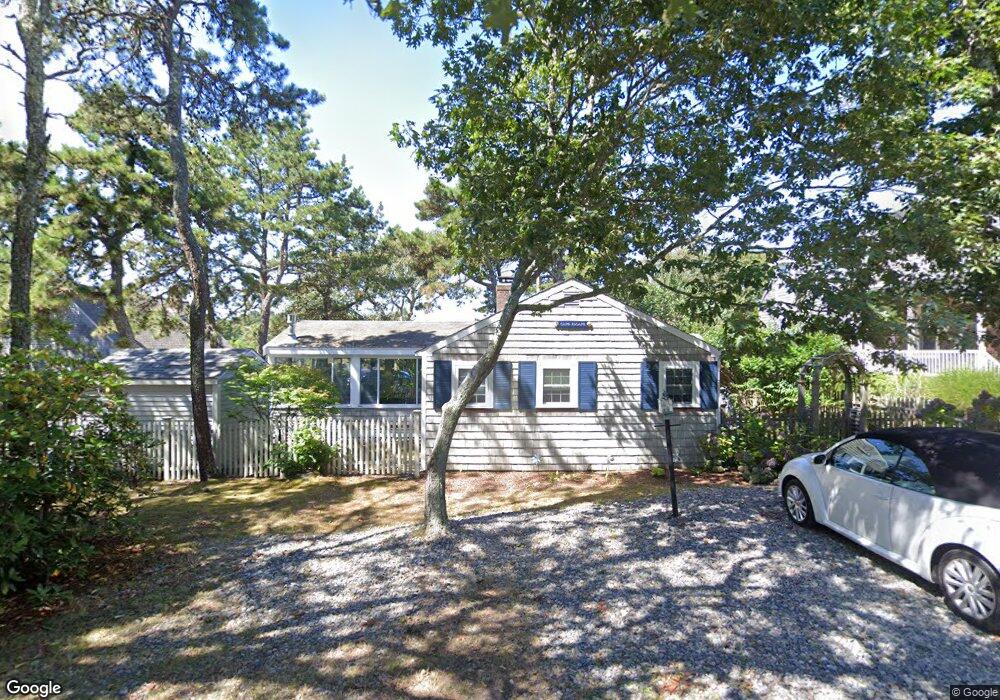
35 Caleb St Dennis Port, MA 2639
Dennis Port NeighborhoodEstimated Value: $574,000 - $746,000
3
Beds
1
Bath
800
Sq Ft
$796/Sq Ft
Est. Value
About This Home
This home is located at 35 Caleb St, Dennis Port, MA 2639 and is currently estimated at $637,172, approximately $796 per square foot. 35 Caleb St is a home located in Barnstable County with nearby schools including Dennis-Yarmouth Regional High School and St. Pius X. School.
Ownership History
Date
Name
Owned For
Owner Type
Purchase Details
Closed on
Jun 1, 2023
Sold by
Meuter-Smith Michelle A and Meuter Frederick H
Bought by
Meuter Smith Michelle A
Current Estimated Value
Purchase Details
Closed on
Jan 9, 2015
Sold by
Cox William M
Bought by
Cox Michelle A and Meuter Michelle A
Purchase Details
Closed on
Oct 25, 2002
Sold by
Keefe David J
Bought by
Cox William M and Meuter Frederick H
Home Financials for this Owner
Home Financials are based on the most recent Mortgage that was taken out on this home.
Original Mortgage
$192,000
Interest Rate
6.2%
Mortgage Type
Purchase Money Mortgage
Create a Home Valuation Report for This Property
The Home Valuation Report is an in-depth analysis detailing your home's value as well as a comparison with similar homes in the area
Home Values in the Area
Average Home Value in this Area
Purchase History
| Date | Buyer | Sale Price | Title Company |
|---|---|---|---|
| Meuter Smith Michelle A | -- | None Available | |
| Meuter Smith Michelle A | -- | None Available | |
| Cox Michelle A | -- | -- | |
| Cox Michelle A | -- | -- | |
| Cox William M | $279,900 | -- | |
| Cox William M | $279,900 | -- |
Source: Public Records
Mortgage History
| Date | Status | Borrower | Loan Amount |
|---|---|---|---|
| Previous Owner | Cox William M | $179,000 | |
| Previous Owner | Cox William M | $192,000 |
Source: Public Records
Tax History Compared to Growth
Tax History
| Year | Tax Paid | Tax Assessment Tax Assessment Total Assessment is a certain percentage of the fair market value that is determined by local assessors to be the total taxable value of land and additions on the property. | Land | Improvement |
|---|---|---|---|---|
| 2025 | $2,398 | $553,700 | $245,800 | $307,900 |
| 2024 | $2,265 | $515,900 | $236,400 | $279,500 |
| 2023 | $2,191 | $469,100 | $214,900 | $254,200 |
| 2022 | $2,186 | $390,300 | $202,600 | $187,700 |
| 2021 | $2,133 | $353,800 | $198,600 | $155,200 |
| 2020 | $2,218 | $363,600 | $220,700 | $142,900 |
| 2019 | $0 | $342,000 | $216,400 | $125,600 |
| 2018 | $0 | $287,300 | $173,000 | $114,300 |
| 2017 | $1,755 | $285,300 | $173,000 | $112,300 |
| 2016 | $1,723 | $263,800 | $168,900 | $94,900 |
| 2015 | $1,688 | $263,800 | $168,900 | $94,900 |
| 2014 | $1,581 | $249,000 | $164,800 | $84,200 |
Source: Public Records
Map
Nearby Homes
- 1 Belmont Rd Unit 630
- 1 Belmont Rd Unit 513
- 1 E Belmont Unit 630
- 26 Manning Rd
- 11 Ocean Park W
- 3 Fairbanks Dr
- 9 Chase Ave Unit 6
- 159 Center St Unit 22
- 402 Old Wharf Rd
- 402 Old Wharf Rd
- 405 Old Wharf Rd Unit B204
- 405 Old Wharf Rd Unit B204
- 73 Division St
- 12 Cross St
- 19 Riverway
- 148 Belmont Rd
- 19 Riverway
- 102 Sea St
- 24 Chase St
- 24 Chase St