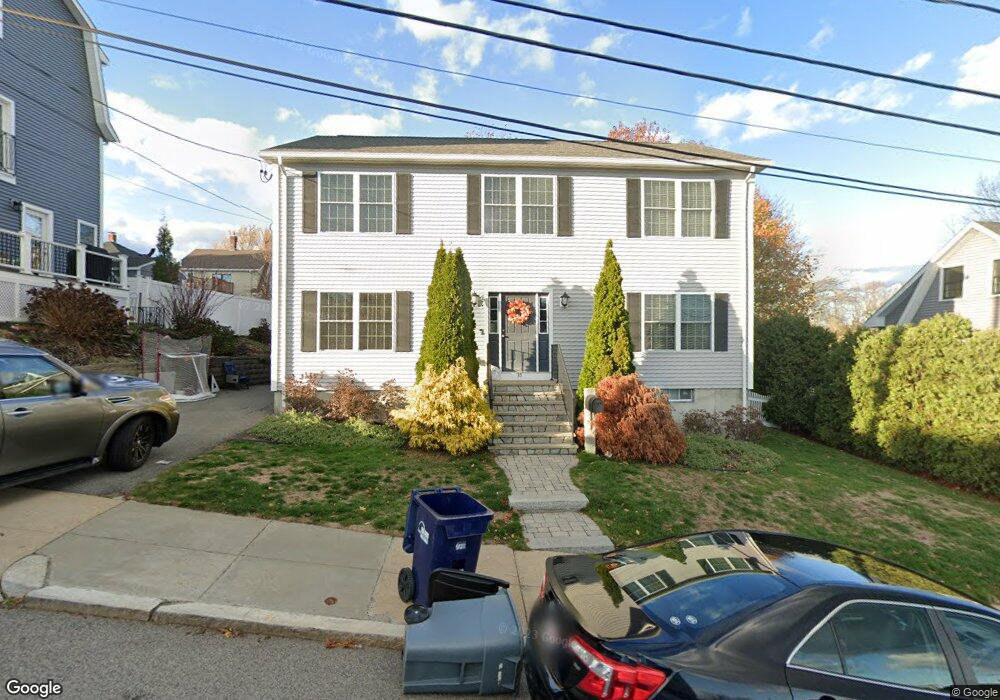
35 Cedar Grove St Dorchester Center, MA 02124
Lower Mills NeighborhoodEstimated Value: $753,000 - $1,162,000
2
Beds
1
Bath
805
Sq Ft
$1,258/Sq Ft
Est. Value
About This Home
This home is located at 35 Cedar Grove St, Dorchester Center, MA 02124 and is currently estimated at $1,012,574, approximately $1,257 per square foot. 35 Cedar Grove St is a home located in Suffolk County with nearby schools including Conservatory Lab Upper School, St Brendan School, and Saint John Paul II Catholic Academy.
Ownership History
Date
Name
Owned For
Owner Type
Purchase Details
Closed on
Feb 11, 2025
Sold by
Teehan John D and Teehan Tara
Bought by
Fourtees Ft 2025 and Teehan
Current Estimated Value
Purchase Details
Closed on
Sep 28, 2007
Sold by
Boyle Jeanne M and Boyle Julia A
Bought by
Teehan John D and Teehan Tara J
Purchase Details
Closed on
Oct 15, 2004
Sold by
Boyle Julie A
Bought by
Boyle Julie A and Boyle Jeanne M
Purchase Details
Closed on
Jun 28, 2001
Sold by
Hamilton Joanna L
Bought by
Skillin Daniel M
Purchase Details
Closed on
Dec 1, 1998
Sold by
Stone Margaret E Est
Bought by
Clinton Joanna and Hamilton Daniel
Create a Home Valuation Report for This Property
The Home Valuation Report is an in-depth analysis detailing your home's value as well as a comparison with similar homes in the area
Home Values in the Area
Average Home Value in this Area
Purchase History
| Date | Buyer | Sale Price | Title Company |
|---|---|---|---|
| Fourtees Ft 2025 | -- | None Available | |
| Fourtees Ft 2025 | -- | None Available | |
| Fourtees Ft 2025 | -- | None Available | |
| Teehan John D | $344,000 | -- | |
| Teehan John D | $344,000 | -- | |
| Boyle Julie A | -- | -- | |
| Boyle Julie A | $330,000 | -- | |
| Boyle Julie A | $330,000 | -- | |
| Skillin Daniel M | $190,000 | -- | |
| Skillin Daniel M | $190,000 | -- | |
| Clinton Joanna | $120,000 | -- | |
| Clinton Joanna | $120,000 | -- |
Source: Public Records
Mortgage History
| Date | Status | Borrower | Loan Amount |
|---|---|---|---|
| Previous Owner | Clinton Joanna | $400,000 | |
| Previous Owner | Clinton Joanna | $50,000 |
Source: Public Records
Tax History Compared to Growth
Tax History
| Year | Tax Paid | Tax Assessment Tax Assessment Total Assessment is a certain percentage of the fair market value that is determined by local assessors to be the total taxable value of land and additions on the property. | Land | Improvement |
|---|---|---|---|---|
| 2025 | $12,073 | $1,042,600 | $362,100 | $680,500 |
| 2024 | $11,053 | $1,014,000 | $254,000 | $760,000 |
| 2023 | $10,182 | $948,000 | $237,500 | $710,500 |
| 2022 | $9,918 | $911,600 | $228,400 | $683,200 |
| 2021 | $9,146 | $857,200 | $217,500 | $639,700 |
| 2020 | $7,762 | $735,000 | $209,600 | $525,400 |
| 2019 | $7,242 | $687,135 | $165,965 | $521,170 |
| 2018 | $6,607 | $630,420 | $165,965 | $464,455 |
| 2017 | $6,358 | $600,400 | $165,965 | $434,435 |
| 2016 | $6,115 | $555,940 | $165,965 | $389,975 |
| 2015 | $6,150 | $507,870 | $158,650 | $349,220 |
| 2014 | $6,549 | $520,600 | $167,400 | $353,200 |
Source: Public Records
Map
Nearby Homes
- 61 Hill Top St
- 118-120 Granite Ave Unit 2
- 103 Minot St
- 107 Minot St
- 102 Milton St
- 45 Chickatawbut St Unit 1
- 43 Chickatawbut St
- 22 Chickatawbut St Unit 2
- 701 Adams St Unit 9
- 378 Neponset Ave
- 400-412 Neponset Ave
- 251 Minot St Unit 6
- 40 Westmoreland St Unit 8
- 885-887 Adams St Unit 1
- 37 Westmoreland St
- 60 Newbury St Unit 10
- 859 Adams St Unit 859
- 80 Beaumont St Unit 101
- 51 Coffey St Unit 51C
- 37 Rangeley St
- 37 Cedar Grove St
- 25 Cedar Grove St
- 195 Milton St
- 191 Milton St
- 41 Cedar Grove St
- 189 Milton St
- 36 Cedar Grove St
- 201 Milton St
- 45 Cedar Grove St
- 45 Cedar Grove St Unit SF
- 40 Cedar Grove St
- 187 Milton St
- 205 Milton St
- 17 Cedar Grove St
- 16 Cedar Grove St
- 51 Cedar Grove St
- 185 Milton St
- 48 Cedar Grove St
- 1 Hill Top St
- 192 Milton St