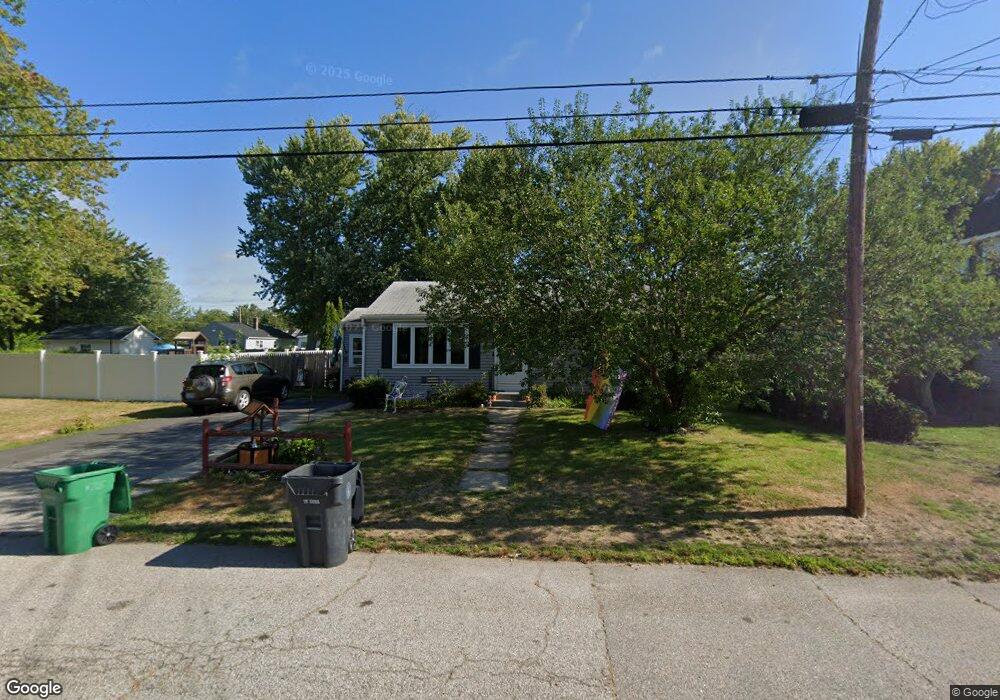
35 Chapmans Ave Warwick, RI 02886
Greenwood NeighborhoodEstimated Value: $347,000 - $361,000
2
Beds
1
Bath
896
Sq Ft
$397/Sq Ft
Est. Value
About This Home
This home is located at 35 Chapmans Ave, Warwick, RI 02886 and is currently estimated at $355,364, approximately $396 per square foot. 35 Chapmans Ave is a home located in Kent County with nearby schools including St Rose Of Lima School.
Ownership History
Date
Name
Owned For
Owner Type
Purchase Details
Closed on
Nov 8, 1995
Sold by
Mckenna Raymond J Est
Bought by
Fonseca Anthony J and Fonseca Lisa
Current Estimated Value
Home Financials for this Owner
Home Financials are based on the most recent Mortgage that was taken out on this home.
Original Mortgage
$70,296
Interest Rate
7.62%
Mortgage Type
Purchase Money Mortgage
Create a Home Valuation Report for This Property
The Home Valuation Report is an in-depth analysis detailing your home's value as well as a comparison with similar homes in the area
Home Values in the Area
Average Home Value in this Area
Purchase History
| Date | Buyer | Sale Price | Title Company |
|---|---|---|---|
| Fonseca Anthony J | $70,000 | -- |
Source: Public Records
Mortgage History
| Date | Status | Borrower | Loan Amount |
|---|---|---|---|
| Open | Fonseca Anthony J | $90,000 | |
| Closed | Fonseca Anthony J | $79,000 | |
| Closed | Fonseca Anthony J | $14,800 | |
| Closed | Fonseca Anthony J | $70,296 |
Source: Public Records
Tax History
| Year | Tax Paid | Tax Assessment Tax Assessment Total Assessment is a certain percentage of the fair market value that is determined by local assessors to be the total taxable value of land and additions on the property. | Land | Improvement |
|---|---|---|---|---|
| 2025 | $4,309 | $339,300 | $134,500 | $204,800 |
| 2024 | $3,975 | $274,700 | $117,000 | $157,700 |
| 2023 | $3,864 | $272,300 | $117,000 | $155,300 |
| 2022 | $3,901 | $208,300 | $91,300 | $117,000 |
| 2021 | $3,901 | $208,300 | $91,300 | $117,000 |
| 2020 | $3,901 | $208,300 | $91,300 | $117,000 |
| 2019 | $3,901 | $208,300 | $91,300 | $117,000 |
| 2018 | $3,326 | $159,900 | $85,000 | $74,900 |
| 2017 | $3,236 | $159,900 | $85,000 | $74,900 |
| 2016 | $3,236 | $159,900 | $85,000 | $74,900 |
| 2015 | $2,847 | $137,200 | $74,900 | $62,300 |
| 2014 | $2,752 | $137,200 | $74,900 | $62,300 |
| 2013 | $2,715 | $137,200 | $74,900 | $62,300 |
Source: Public Records
Map
Nearby Homes
- 652 Main Ave
- 157 George Arden Ave
- 207 Morse Ave
- 233 Palace Ave
- 232 Greenwood Ave
- 2907 Post Rd Unit 6
- 2907 Post Rd Unit 4
- 2907 Post Rd Unit 2
- 2907 Post Rd Unit 5
- 2907 Post Rd Unit 8
- 2907 Post Rd Unit 3
- 143 Morse Ave
- 5 Barre Ct
- 68 Packard Ave
- 333 Greenwood Ave
- 833 Halifax Dr
- 816 Williamsbug Cir Unit 816
- 302 Chatham Cir
- 122 Edaville Ct
- 892 Halifax Dr
Your Personal Tour Guide
Ask me questions while you tour the home.