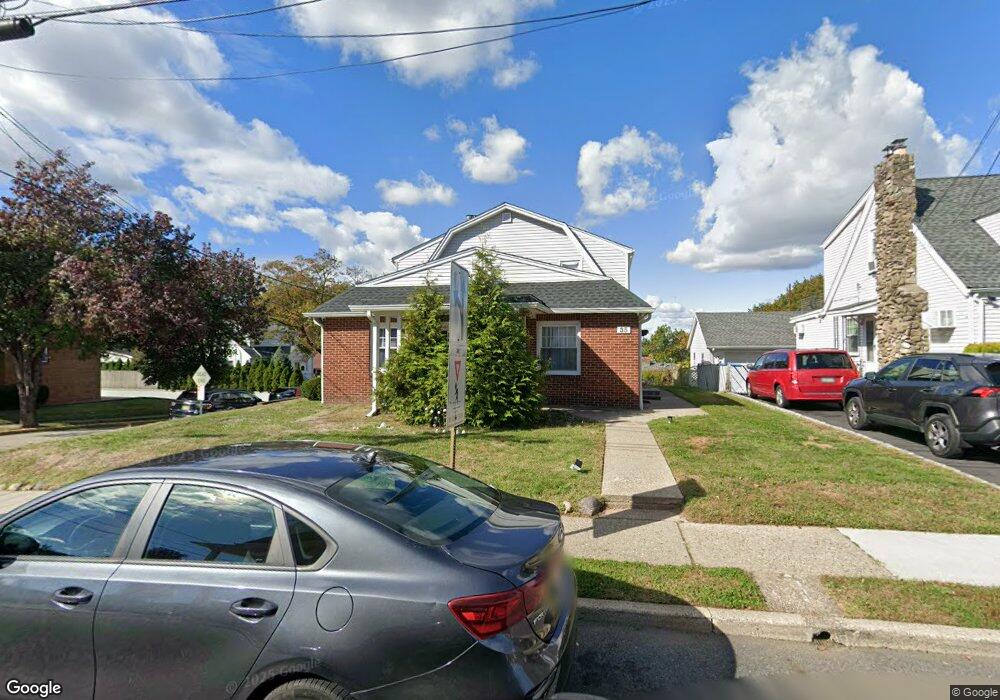
35 Chestnut St Unit 1R Wallington, NJ 07057
Estimated Value: $872,000 - $985,000
2
Beds
1
Bath
2,728
Sq Ft
$343/Sq Ft
Est. Value
About This Home
This home is located at 35 Chestnut St Unit 1R, Wallington, NJ 07057 and is currently estimated at $936,872, approximately $343 per square foot. 35 Chestnut St Unit 1R is a home located in Bergen County with nearby schools including Wallington Jr Sr High School and Mesivta Tiferes Rav Zvi Aryeh Zemel.
Ownership History
Date
Name
Owned For
Owner Type
Purchase Details
Closed on
Aug 18, 2022
Sold by
Hermey Christopher and Hermey Patricia
Bought by
35 Chestnut Llc
Current Estimated Value
Home Financials for this Owner
Home Financials are based on the most recent Mortgage that was taken out on this home.
Original Mortgage
$350,000
Outstanding Balance
$335,458
Interest Rate
6%
Mortgage Type
New Conventional
Estimated Equity
$601,414
Purchase Details
Closed on
Dec 27, 2002
Sold by
Jackson Joan
Bought by
Hermey Christopher
Home Financials for this Owner
Home Financials are based on the most recent Mortgage that was taken out on this home.
Original Mortgage
$351,000
Interest Rate
5.99%
Purchase Details
Closed on
Jan 10, 2000
Sold by
Jackson Joan and Estate Of Emory Miskuff
Bought by
Jackson Joan
Create a Home Valuation Report for This Property
The Home Valuation Report is an in-depth analysis detailing your home's value as well as a comparison with similar homes in the area
Home Values in the Area
Average Home Value in this Area
Purchase History
| Date | Buyer | Sale Price | Title Company |
|---|---|---|---|
| 35 Chestnut Llc | $700,000 | Old Republic Title | |
| 35 Chestnut Llc | $700,000 | Old Republic Title | |
| Hermey Christopher | $390,000 | -- | |
| Jackson Joan | -- | -- |
Source: Public Records
Mortgage History
| Date | Status | Borrower | Loan Amount |
|---|---|---|---|
| Open | 35 Chestnut Llc | $350,000 | |
| Closed | 35 Chestnut Llc | $350,000 | |
| Previous Owner | Hermey Christopher | $351,000 |
Source: Public Records
Tax History
| Year | Tax Paid | Tax Assessment Tax Assessment Total Assessment is a certain percentage of the fair market value that is determined by local assessors to be the total taxable value of land and additions on the property. | Land | Improvement |
|---|---|---|---|---|
| 2025 | $14,145 | $939,800 | $240,000 | $699,800 |
| 2024 | $13,608 | $415,900 | $145,000 | $270,900 |
| 2023 | $13,325 | $415,900 | $145,000 | $270,900 |
| 2022 | $13,325 | $415,900 | $145,000 | $270,900 |
| 2021 | $13,097 | $415,900 | $145,000 | $270,900 |
| 2020 | $12,831 | $415,900 | $145,000 | $270,900 |
| 2019 | $12,423 | $415,900 | $145,000 | $270,900 |
| 2018 | $12,277 | $415,900 | $145,000 | $270,900 |
| 2017 | $12,123 | $415,900 | $145,000 | $270,900 |
| 2016 | $11,886 | $415,900 | $145,000 | $270,900 |
| 2015 | $11,379 | $415,900 | $145,000 | $270,900 |
| 2014 | $10,797 | $415,900 | $145,000 | $270,900 |
Source: Public Records
Map
Nearby Homes
- 351 Main Ave
- 70 Leahy Dr
- 68 Leahy Dr Unit 4904
- 69 Arnold Dr Unit 5810
- 39 Tuttle St
- 75 Midland Ave
- 6 Hillside Terrace
- 185 Wesmont Dr
- 129 Truman Dr
- 223 Bradley Dr
- 84 Truman Dr Unit 2801
- 62 Truman Dr
- 165 Roosevelt Dr
- 69 Truman Dr
- 80 Koster St
- 94 Locust Ave
- 255 Windsor Rd
- 84 Locust Ave
- 62 Roosevelt Dr
- 75 Wesmont Dr
Your Personal Tour Guide
Ask me questions while you tour the home.