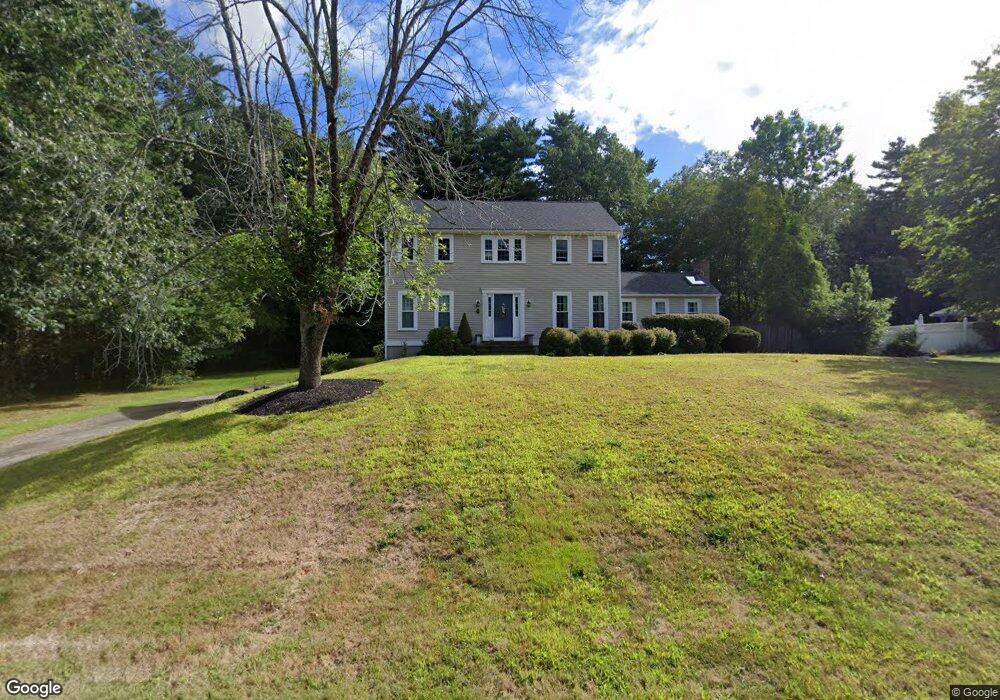
35 Clark Cir Hanover, MA 02339
Estimated Value: $916,598 - $1,045,000
4
Beds
3
Baths
2,336
Sq Ft
$414/Sq Ft
Est. Value
About This Home
This home is located at 35 Clark Cir, Hanover, MA 02339 and is currently estimated at $966,150, approximately $413 per square foot. 35 Clark Cir is a home located in Plymouth County with nearby schools including Hanover High School, Calvary Chapel Academy, and Holy Family Elementary School.
Ownership History
Date
Name
Owned For
Owner Type
Purchase Details
Closed on
Jun 26, 2013
Sold by
Lafauci David W and Lafauci Celeste B
Bought by
Conroy Kristen M
Current Estimated Value
Home Financials for this Owner
Home Financials are based on the most recent Mortgage that was taken out on this home.
Original Mortgage
$404,000
Outstanding Balance
$288,610
Interest Rate
3.51%
Mortgage Type
New Conventional
Estimated Equity
$677,540
Create a Home Valuation Report for This Property
The Home Valuation Report is an in-depth analysis detailing your home's value as well as a comparison with similar homes in the area
Home Values in the Area
Average Home Value in this Area
Purchase History
| Date | Buyer | Sale Price | Title Company |
|---|---|---|---|
| Conroy Kristen M | $505,000 | -- | |
| Conroy Kristen M | $505,000 | -- |
Source: Public Records
Mortgage History
| Date | Status | Borrower | Loan Amount |
|---|---|---|---|
| Open | Conroy Kristen M | $404,000 | |
| Closed | Conroy Kristen M | $50,440 | |
| Closed | Conroy Kristen M | $404,000 | |
| Previous Owner | Conroy Kristen M | $160,000 | |
| Previous Owner | Conroy Kristen M | $130,600 |
Source: Public Records
Tax History
| Year | Tax Paid | Tax Assessment Tax Assessment Total Assessment is a certain percentage of the fair market value that is determined by local assessors to be the total taxable value of land and additions on the property. | Land | Improvement |
|---|---|---|---|---|
| 2025 | $11,005 | $891,100 | $324,200 | $566,900 |
| 2024 | $10,733 | $835,900 | $324,200 | $511,700 |
| 2023 | $10,167 | $753,700 | $294,600 | $459,100 |
| 2022 | $9,511 | $623,700 | $245,500 | $378,200 |
| 2021 | $9,545 | $584,500 | $223,200 | $361,300 |
| 2020 | $5,647 | $568,400 | $223,200 | $345,200 |
| 2019 | $5,567 | $545,800 | $223,200 | $322,600 |
| 2018 | $8,361 | $513,600 | $223,200 | $290,400 |
| 2017 | $5,236 | $522,900 | $232,300 | $290,600 |
| 2016 | $8,349 | $495,200 | $211,300 | $283,900 |
| 2015 | $8,308 | $514,400 | $230,500 | $283,900 |
Source: Public Records
Map
Nearby Homes
- 17 Hayford Trail Unit 12
- 7 Hayford Trail Unit 12
- 5 Hayford Trail Unit 11
- 22 Howland Trail Unit 34
- 108 Waterford Dr
- 724 Whitman St
- 75 School St
- 139 Fairwood Dr
- 95 Tecumseh Dr
- 561 Circuit St
- 168 Spring St
- 5 Alpine St
- 10 Proud Foot Way
- 696 Summer St
- 23 Live Oak Way
- 430 Brook Bend Rd
- Lot 5 Princeton Way
- 810 Brookline Way
- 84 Liberty St
- 8 Pat Rose Way
Your Personal Tour Guide
Ask me questions while you tour the home.